Figures & data
Figure 1. Schematic outline of the experimental design
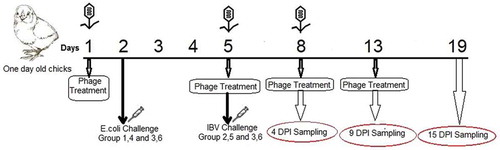
Figure 2. Phylogenetic analysis of IBV samples based on partial HVR1 sequences. Shown sequences represent all infectious bronchitis virus genotypes (GI) proposed by [Citation18] with samples from the present study indicated by black circles. The tree was constructed using the nucleotide substitution of the Hasegawa-Kishino-Yano model with the gammadistributed rate (with four rate categories) with bootstrap value based on 1000 replicates
![Figure 2. Phylogenetic analysis of IBV samples based on partial HVR1 sequences. Shown sequences represent all infectious bronchitis virus genotypes (GI) proposed by [Citation18] with samples from the present study indicated by black circles. The tree was constructed using the nucleotide substitution of the Hasegawa-Kishino-Yano model with the gammadistributed rate (with four rate categories) with bootstrap value based on 1000 replicates](/cms/asset/415b6d20-fe72-477a-8614-5742e822c894/ziee_a_1686822_f0002_b.gif)
Figure 3. Clinical signs scoring in different groups. No signs were recorded as 0, mild signs included mild gasping, coughing or depression and were recorded as 1, and severe gasping, coughing or depression with ruffled feathers was considered as severe signs and recorded as 2. Birds with severe signs unable to move were recorded as 3 and humanely culled and samples collected. Birds which unexpectedly succumbed to disease were also recorded as 3 and samples collected. Each dot represents the mean of the clinical signs scoring of all birds in the group at each time point.
Figure 4. Average percentage of mortality in different groups (birds per group at each time point). The highest and earliest mortality was associated with mixed infections without bacteriophage treatment. In contrast, no deaths occurred in bacteriophage treated groups with mixed infection.
Figure 5. the E.coli bacterial counts. Samples were collected at 4, 9 and 15 dpc and are represented by the mean log10 CFU/ml of samples collected and tested from three birds. T-tests were performed. * p < 0.05, * * p < 0.01, ***p < 0.001 or ns for non-significant. The asterisks over columns represent a significant difference comparing to APEC the infected group. Asterisks over lines represent a significant difference between the mixed infection groups with and without bacteriophage treatments. Significantly higher counts with gradually increased bacterial shedding are observed in non-treated groups.
Figure 6. IBV titers. The IBV titers of samples collected at 4, 9 and 15 dpc are represented by the mean log10 EID50/ml of samples collected and tested from three birds. T-tests were performed. * p < 0.05, ** p < 0.01, and ns for non-significant. The asterisks over columns represent a significant difference compared to the IBV infected group. Asterisks over lines represent a significant difference between mixed infection groups with and without bacteriophage treatments. Significantly lower viral titers were observed in the mixed infection group treated with bacteriophages.