
Figures & data
Table 1. Gender distribution.
Table 2. Level of education.
Table 3. The age of the respondents.
Figure 1. Legend: Mean number of tick bites acquired in the residence (‘home’) municipality displayed over population density (persons/km2). Municipalities coloured blue had no respondent in the survey. Municipalities coloured red had one to five respondents. The rest had over five respondents. The figure displays maps for Denmark, Norway and Sweden.
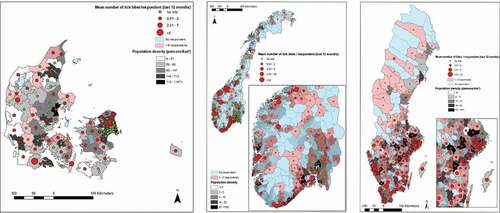
Figure 2. Legend: Number of times a municipality was cited as ‘other place’ of tick bite for respondents not being bitten in the residence municipality displayed over population density (persons/km2). The figure displays maps for Denmark, Norway and Sweden.
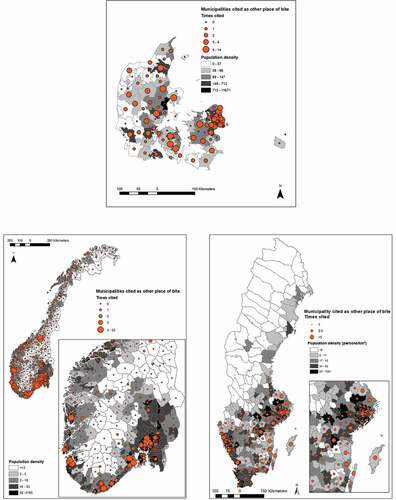
Figure 3. Legend: Correlation indices between original variables and the four (Denmark and Sweden) or five (Norway) dimensions bearing at least 5% of the total variance resulting from the principal component analyses (PCA) at country level on individual responses. Darker blue/larger circle indicate stronger contributions. The figure displays the PCA for Denmark, Norway and Sweden.
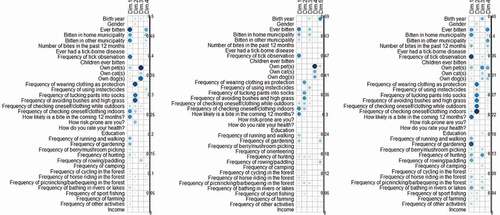
Table 4. Number of respondents with tick bites and place of tick bite.
Table 5. Number of tick bites per respondent last 12 months.
Table 6. Have you got children under 18 years of age and have they been bitten?