Figures & data
Table 1. List of bioclimatic variables used for modelling the distribution of Ae. aegypti and dengue occurrence.
Figure 1. Variable importance (bio1 = annual mean temperature, bio5 = maximum temperature of warmest month, bio6 = minimum temperature of coldest month, bio7 = annual temperature range (Bio05–Bio06), bio12 = annual precipitation, bio13 = precipitation of wettest month, and bio14 = precipitation of driest month).
Table 2. Accuracy assessments (AUC and TSS) of five models used for predicting current and future habitat suitability for Ae. aegypti in Africa.
Table 3. Percentage of coverage by the 4 classes of habitat suitability under the current and future (2050 and 2070) climate scenarios (RCP4.5 and RCP8.5) for Ae. aegypti in relation to dengue fever incidence in Africa.
Table 4. Percentage of % change of habitat suitability in 2050 and 2070 climate scenarios (RCP4.5 and RCP8.5) for Ae. aegypti compared to the current climatic condition.
Figure 2. Map showing the current habitat suitability for Ae. aegypti in relation to dengue fever incidences in Africa. Grey to green colours illustrate gradients of habitat suitability from low to high.
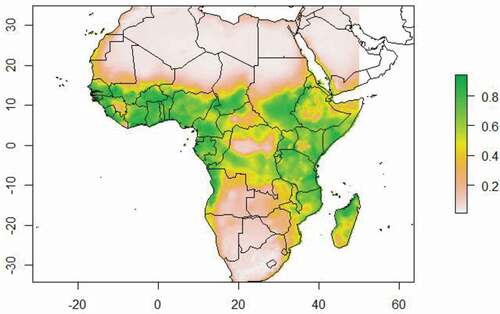
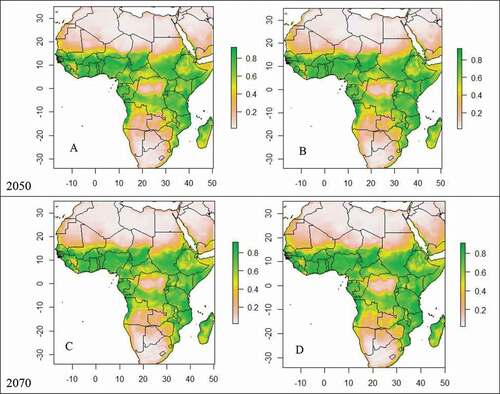
Figure 3. Future continental suitability for Ae. aegypti associated with dengue fever incidences in Africa by 2050 under RCP4.5 (A) and RCP 8.5 (B) and by 2070 under RCP4.5 (C) and RCP 8.5 (D). Grey to green colours illustrate the gradient of suitability from low to high.