Figures & data
Table 1. Serology assessment of COVID-19 IgG and IgM response by COVID-19 Antibody Test IgM/IgG (ZetaGene, Sweden) in sera collected from hospitalized (n = 12) and non-hospitalized (n = 33) PCR-confirmed COVID-19 patients.
Figure 1. Serum SARS-Cov-2 IgM and IgG antibody detection in response to hospitalization in COVID-19 patients. IgM and IgG reactivity to SARS-CoV-2 was measured in sera in patients with PCR-confirmed COVID-19 (n = 45) by lateral flow test COVID-19 Antibody test IgM/IgG (ZetaGene, Sweden). Total IgM, IgG and total antibody detection percentage (%) are presented for the hospitalized (red bars, n = 12) and non-hospitalized patients (black bars, n = 33).
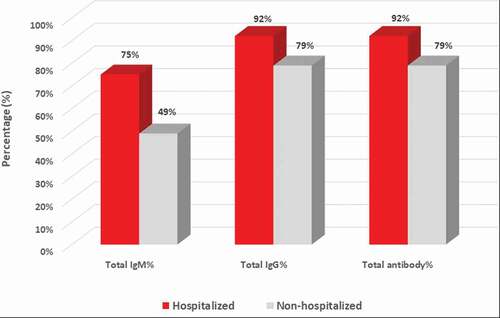
Figure 2. The distribution of COVID-19 IgM and IgG detection in hospitalized vs. non-hospitalized patients. Qualitative detection of IgM and IgG to SARS-CoV-2 was assessed in sera of hospitalized (n = 12) and non-hospitalized (n = 33) COVID-19 patients. IgG and IgM positivity and distribution (%) in the COVID-19 patients are presented in respective color as indicated in the figure.
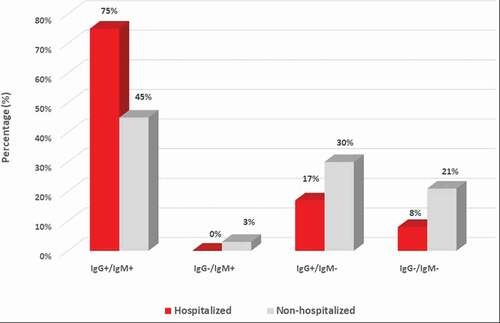
Table 2. Serology assessment of COVID-19 IgG and IgM response by COVID-19 Antibody Test IgM/IgG (ZetaGene, Sweden) in PCR-confirmed COVID-19 patients with time after onset <2 weeks (n = 8).
Table 3. Serology assessment of COVID-19 IgG and IgM response by COVID-19 Antibody Test IgM/IgG (ZetaGene, Sweden) in PCR-confirmed non-hospitalized COVID-19 patients with time after onset >2 weeks (n = 26).
Table 4. Serology assessment of COVID-19 IgG and IgM response by COVID-19 Antibody Test IgM/IgG (ZetaGene, Sweden) in PCR-confirmed hospitalized COVID-19 patients with time after onset >2 weeks (n = 11).
Figure 3. The distribution of antibody detection in response to time from onset and hospitalization. Total IgM, IgG and total antibody detection percentage (%) are presented for PCR-confirmed COVID-19 patients divided into the following groups: (1) acute patients with < 2 weeks (w) after onset (n = 8); (2) convalescent patients with > 2 weeks after onset, non-hospitalized (n = 26); (3) convalescent patients with > 2 weeks after onset, hospitalized (n = 11). Different groups are presented in respective colors as indicated in the figure.
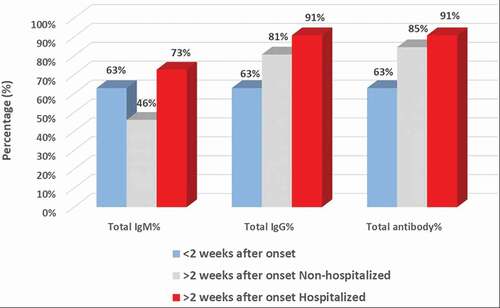
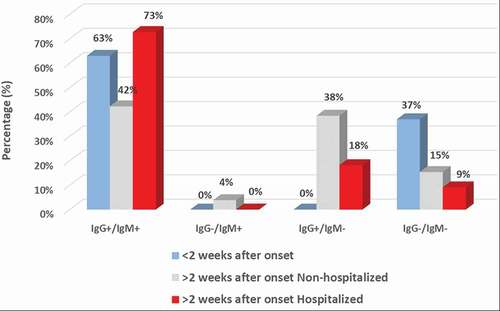
Figure 4. The dynamics of COVID-19 IgM/IgG detection in response to time from onset and hospitalization. Qualitative detection of IgM and IgG to SARS-CoV-2 is mapped in COVID-19 cohort patients from the following groups: (1) acute patients with < 2 weeks (w) after onset (n = 8); (2) convalescent patients with > 2 weeks after onset, non-hospitalized (n = 26); (3) convalescent patients with > 2 weeks after onset, hospitalized (n = 11). IgM and IgG detection percentage (%) is presented in respective color as indicated in the figure.