Figures & data
Table 1. Primers sets used for the identification of Campylobacter species.
Figure 1. A gel image of PCR confirmed C. jejuni. Lane M: 100 bp DNA ladder, lane 1: positive control (C. jejuni ATCC 33560), lane 2: negative control, lane 3–6: positive C. jejuni isolates (161 bp) while image B are some confirmed C. coli. Lane 1: positive control (C. coli ATCC 33559), lane 2: negative control, lane 3–8: positive C. coli isolates (502 bp).
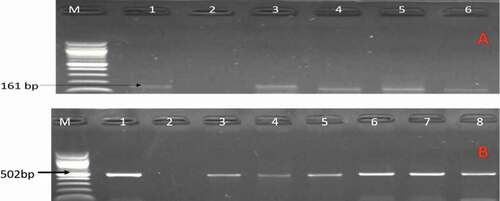
Figure 2. Gel ERIC-PCR amplification results of C. jejuni isolates. M, DNA ladder, 1–18: some amplified C. jejuni isolates.
Figure 3. UPGMA dendrogram image obtained from cluster analysis showing the relationship and diversity of 36 C. jejuni isolates from different sources using ERIC-PCR technique.
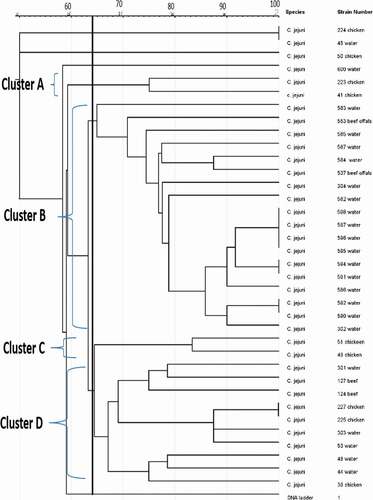
Figure 4. Gel ERIC-PCR amplification results of C. coli isolates. M, DNA ladder, 1–18: some amplified C. coli isolates.
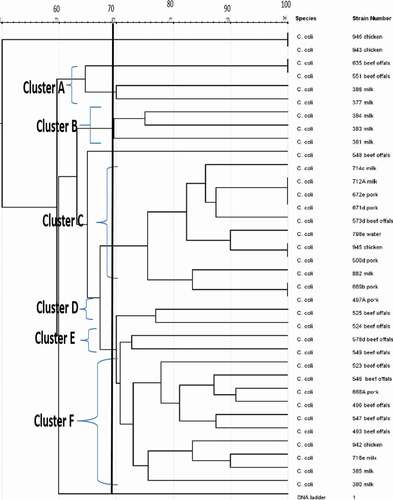
Figure 5. UPGMA dendrogram image obtained from cluster analysis showing the relationship and diversity of 35 C. coli isolates from different sources using ERIC-PCR technique.