
Figures & data
Table 1. Iranian wild bird samples obtained in October 2019 from several live bird markets in northern Iran and testing positive for avian influenza virus
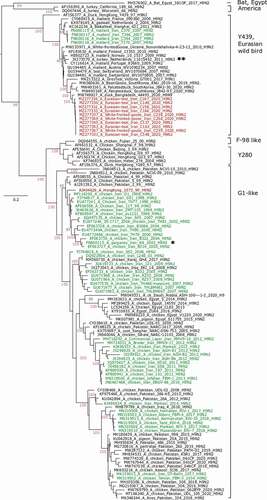
Figure 1. Phylogenetic analysis of the hemagglutinin open reading frame of H9N2 viruses from Iran. Trees were generated by maximum likelihood calculations using the IQ Tree software version 2.1.1 applying the best fit codon-based model according to the Bayesian informative criterion MG+F1X4+G4. Numbers at nodes signal robustness according to ultrafast bootstrap support. Red colored sequences have been established in this study. Other sequences from Iran have been labelled green. Clades within the H9 HA subtype are indicated to the right of the tree. Asterisks denote switches of Y439- and G1-like viruses between wild bird and poultry populations as explained in the discussion
Supplemental Material
Download MS Word (1.8 MB)Data availability statement and data deposition
All data established are either shown in the manuscript or are available at public databases (NCBI GenBank). https://www.ncbi.nlm.nih.gov/nucleotide/.