Figures & data
Table 1. Baseline characteristics of the cohort participants
Figure 1. Detection of SARS-CoV-2 in saliva specimens and nasopharyngeal (NPH) swab specimens. samples were obtained from 44 patients with COVID-19. (a) detection of SARS-CoV-2 is presented by RT-PCR Ct values in patients with available NPH and saliva samples (n = 40). the lines indicate samples from the same patient. Ct values in NPH are significantly lower than those in saliva (p < 0.01 by Wilcoxon signed-ranked test). Pearson’s correlation coefficient was performed on RT-PCR Ct values above detection threshold (Ct<40) in (b) NPH and saliva samples Ct values (n = 32; r = 0.64, p < 0.001); (c) NPH Ct values and symptom duration (n = 40; r = 0.58, p < 0.001); (d) saliva Ct values and symptom duration (n = 34; r = 0.54, p < 0.001)
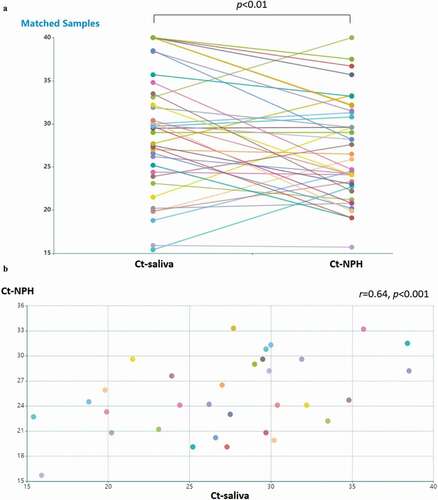
Figure 1. (Continued)
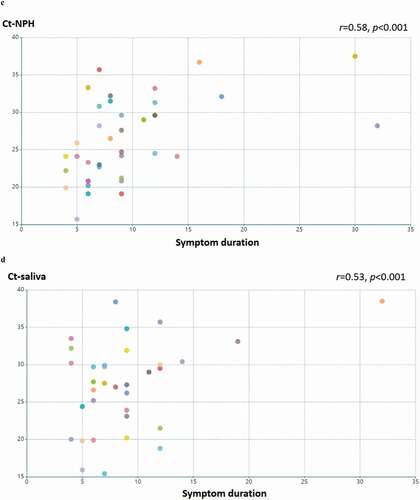
Table 2. Positive detection of SARS-CoV-2 on saliva samples by rapid antigen tests
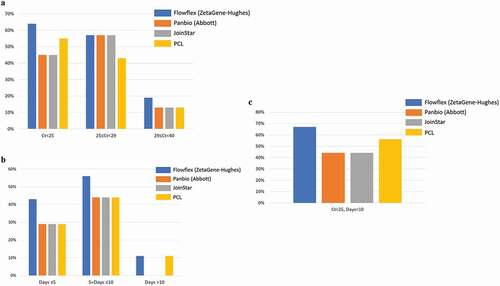
Figure 2. Positive detection rate of SARS-CoV-2 in saliva samples by four SARS-CoV-2 rapid antigen tests: Flowflex (Flowflex SARS-CoV-2 rapid antigen test, ZetaGene-Hughes healthcare, Sweden/UK; blue bars), Panbio (Panbio COVID-19 ag rapid test, Abbott, UK; Orange bars), Joinstar (Joinstar COVID-19 antigen rapid test, China; grey bars), PCL (PCL COVID-19 ag antigen gold saliva lateral flow test, Korea; yellow bars). Saliva specimens were collected from patients with confirmed COVID-19 (n = 44), and 34 samples were above the threshold of detection by RT-PCR (Ct<40). Patients were grouped according to (a) PCR Ct values: Ct<25; 25≤ Ct<29; 29≤ Ct<40; (b) days after COVID-19 symptoms onset: Days≤5; 5< Days≤10; Days≥10; (c) Ct<25, Days<10