Figures & data
Figure 1. Study area with the 103 individual gardens (points with 500 m buffers) and land use units, such as agriculture, forest, water body, park or garden allotment, settlement, and street, which may affect the occurrence and abundance of questing Ixodes ricinus ticks. Source of land use data: German Authoritative Real Estate Cadastre Information System ALKIS® (LGLN - Landesamt für Geoinformation und Landesvermessung Niedersachsen, 2014).
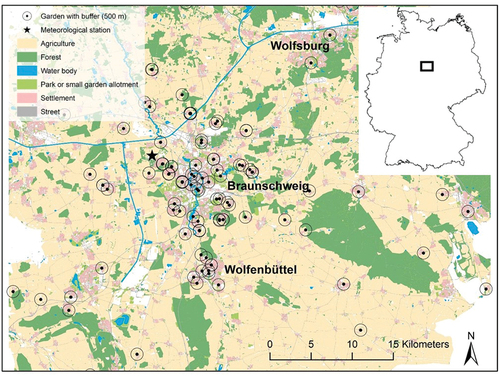
Figure 2. Examples of the predictor variables on the garden level: vegetation type (a–e) including no vegetation (a), lawn (b), groundcover (c), hedge (d), and flower bed (e); vegetation density (f–h) including no vegetation (f), sparse vegetation (g), and dense vegetation (h); and ground type (i–k) including bare soil (i), litter (j), and vegetated ground (k).
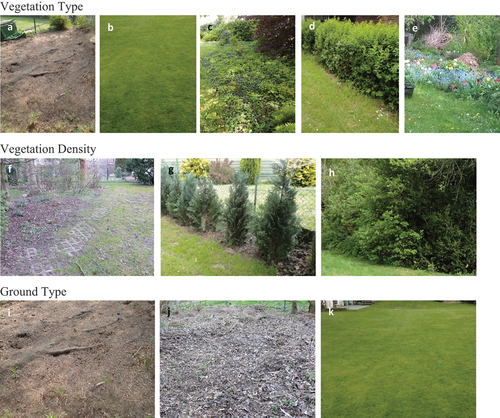
Figure 3. Sampled gardens with minimum and maximum values of the landscape predictor variables, such as forest, agriculture, and sealed area, in their 500 m buffers. Source of land use data: German Authoritative Real Estate Cadastre Information System ALKIS® (LGLN - Landesamt für Geoinformation und Landesvermessung Niedersachsen, 2014).
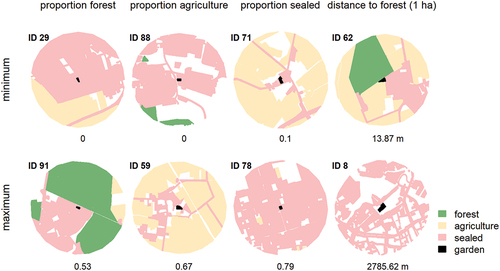
Figure 4. Time series of meteorological covariates during the sampling period in 2015: daily mean air temperature, daily mean relative humidity, and daily precipitation sum. Sampling dates are given as vertical grey lines.
Table 1. Characteristics of potential predictor variables, covariates, and their distribution in and around 103 private gardens in the Braunschweig region. Garden-level predictor variables (In Figure 2 are several examples) characterizing the sample transects (n = 2,666).
Table 2. Characteristics of potential predictor variables, covariates, and their distribution in and around 103 private gardens in the Braunschweig region. Landscape-level predictor variables. Proportions were determined within a 500 m buffer around the garden perimeter (see Figure 3 for gardens with minimum and maximum values of these variables).
Table 3. Characteristics of potential predictor variables, covariates, and their distribution in and around 103 private gardens in the Braunschweig region. Meteorological covariates observed at various times on or before the sampling day. Predictor variables were selected and aggregated according to Kiewra et al. [Citation14].
Figure 5. Proportion of transects with ticks present in the 103 sampled gardens.
Table 4. Distribution of questing Ixodes ricinus ticks on transects on which at least one tick was found, when sampling 2,666 transects in 103 private gardens in the Braunschweig region.
Figure 6. Comparison of the effects of various vegetation types on the occurrence probability (a) and abundance (b) of questing Ixodes ricinus ticks in private gardens in the Braunschweig region. The letters above the boxes denote effects that differ significantly from all other effects with different letters.
Figure 7. Modeled occurrence probabilities of questing Ixodes ricinus ticks in private gardens in the Braunschweig region, characterized by the vegetation type on the sampled transects, related to varying proportions of forest in a 500 m buffer around the garden (left) or related to varying numbers of cumulative hours of air temperatures >8°C on sampling day (right). Shaded areas around the lines display the 95% confidence interval.
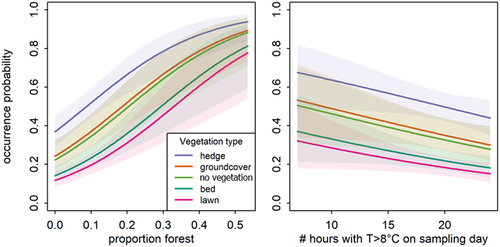
Table 5. Occurrence and abundance of questing nymphal and adult Ixodes ricinus ticks in 103 private gardens in the Braunschweig region in the final generalized linear mixed-effects models and their performance. Reference for comparisons was lawn as vegetation type (intercept), n = 2,666 transects.
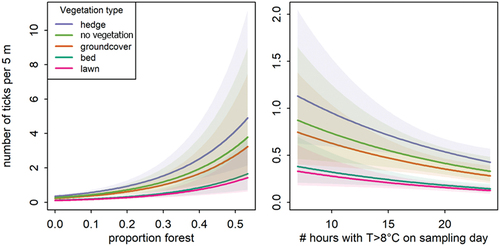
Figure 8. Modeled abundance of questing nymphal and adult Ixodes ricinus ticks on transects, characterized by the vegetation type, in private gardens in the Braunschweig region, related to varying proportions of forest in a 500 m buffer around the garden (left), or related to varying numbers of cumulative hours of air temperatures >8°C (right). Shaded areas around the lines display the 95% confidence interval.