Figures & data
Figure 1. The hot spot analysis algorithm by the Getis-Ord Gi* statistic.
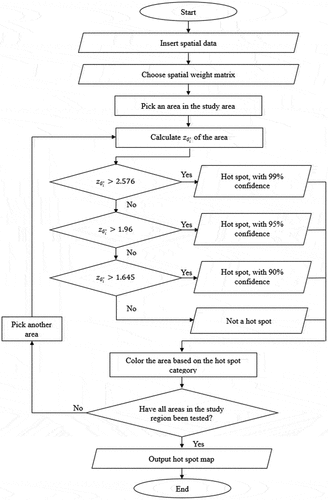
Figure 2. A week-incidence graph illustrating the performance of the SVR model over 20 weeks in 2017. The blue graph represents the number of incidents obtained by SVR, while the orange graph denotes the actual number of incidents.
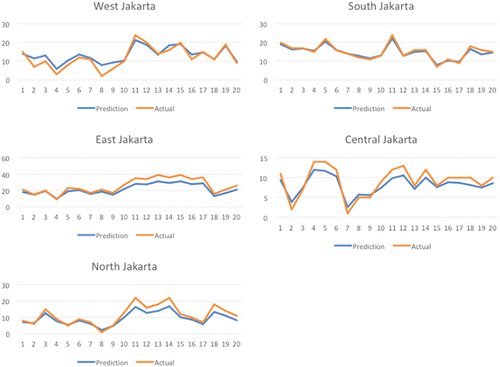
Table 1. Results of the SVR model versus the actual data in the third week of September 2017.
Table 2. Performance of SAE models for estimating DHF incidence measured by mean squared error (MSE) and mean absolute error (MAE).
Table 3. Actual and estimated DHF incidence by the random forest model compared side by side. The estimated values are rounded to the nearest integer.
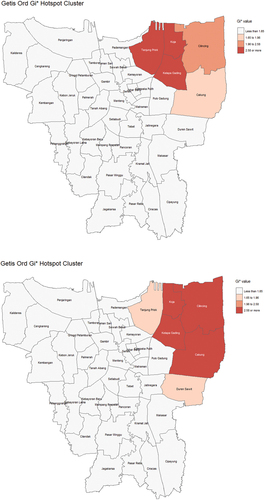
Figure 3. Hot spot map constructed from the DHF incidence estimation (top) and from the actual data (bottom).