
Figures & data
Figure 1. Map of study area in southern Mongolia where green circles show rodent trapping sites in each year. Thin grey lines are 20-meter contour lines and thicker grey lines show small roads that traverse the study area. The town of Gurvantes is shown by the filled grey circle.
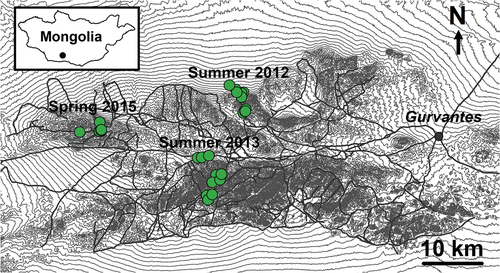
Table 1. Summary of the rodent species caught during the study (voles were only identified to the genus level), disaggregated by sex and year of capture.
Table 2. Estimates of antibody prevalence for five major pathogens based on samples collected from individual rodents and lagomorphs during three sampling events between 2012 and 2015. Prevalence estimates are presented for each pathogen based on: (1) raw data observations summarised across five taxa (Muridae = gerbils, Cricetidae = hamsters and voles, Dipodidae = jerboa, Sciuridae = squirrels and Ochotonidae = pika); these are shown as the number of individuals that tested positive/the total number of individuals tested, and (2) estimated prevalences for each pathogen as derived from GLMMs and summarised according to taxa (across all years), sampling year (across all taxa), and a global prevalence estimate (across all taxa and years). All estimates are described in terms of the mean ± SD of the posterior probability distribution for that group, with the global estimate including the 95% CIs. Because the estimated prevalences are derived from a modelled distribution they do not precisely describe the raw data, but rather use the data from all groups to adjust their group-level mean estimates relative to the group-level sample sizes (see methods).
Table 3. Genera of the zoonotic bacteria identified in rodent ticks (n = 24; pooled into 8 samples) and rodent faeces (n = 39; pooled into 9 samples) where bacterial genera were determined by using NGS methods.
Supplemental Material
Download Zip (16.7 KB)Data availability statement
Data from the study are attached in the supplementary material.