
Figures & data
Figure 1. PRISMA 2009 flow diagram and summary of the literature search and study selection.
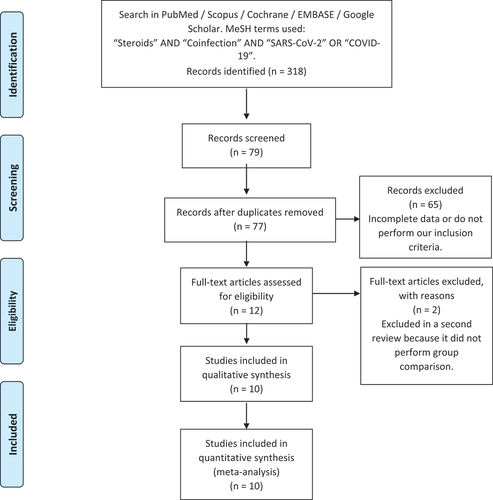
Table 1. General characteristics of the population of patients with COVID-19 in the studies.
Table 2. General characteristics of the patients discriminated by group of steroids and control.
Table 3. Frequency distribution of comorbidities reported in patients with COVID-19.
Table 4. Mortality discriminated by steroid use and control group.
Figure 2. Confidence intervals evaluated through meta-analysis.
It is observed that the 95%CI includes one, and therefore is not significant, i.e. there is not enough evidence to show that the use of steroids in patients with Covid increases the risk of coinfection. Although the summary measure in most studies is greater than one, the CI in 4 of the 6 studies is greater than 1. Three studies (one in favor of coinfection and two against) have extensive CI (low precision).
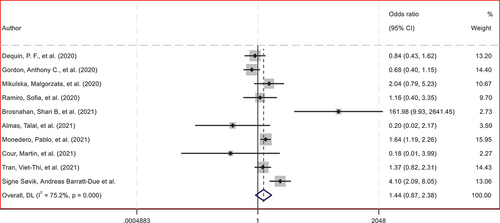
Figure 3. Analysis of publication bias using funnel-plot generated by OR.
This funnel plot shows no selection bias in the studies evaluated, which was corroborated by the egger’s statistical test with a value of p = 0.7564, indicating that the funnel plot is symmetrical, with the effect estimates evenly distributed around the pooled effect estimate.
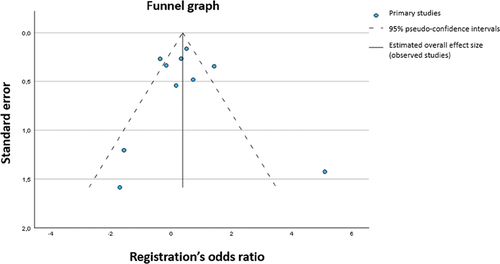
Table 5. Frequency of superinfection discriminated by steroid use and control group.
Table 6. Meta-analysis of steroid use and risk of superinfection.
Supplemental material