
Figures & data
Figure 1. Detection rates of norovirus gastroenteritis during 2015–2020 in Guangxi Region, China (actual detection rate and prediction rate using ARIMA models in 2020 showed a significant difference by paired t-test, p < 0.001).
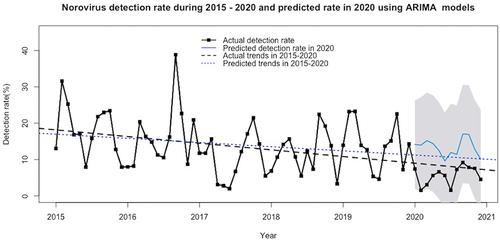
Table 1. Annual detection rates of norovirus gastroenteritis during 2015–2020.
Table 2. Characteristics of norovirus gastroenteritis patients during 2015–2020.
Table 3. Final logistic regression model of factors related to norovirus gastroenteritis (N = 7887).
Table 4. Factors associated with detection of norovirus infection stratified by COVID-19 period.
Data availability statement
Data are available on request due to privacy or other restrictions of the Guangxi Zhuang Autonomous Region Centre for Disease Control and Prevention.