
Figures & data
Figure 1. (a) Chest radiograph showing diffuse bilateral hilar adenopathy with questionable calcified granuloma at the hila (black arrows) noted in Figure 1 (a) and (b). This adenopathy obscures the hilum and the cardiac silhouette. There are bilateral pleural effusions, left greater than right, also appreciated. (b) The lateral view shows a large mass obscuring cardiac silhouette (black arrows) in the anterior compartment of the mediastinum.
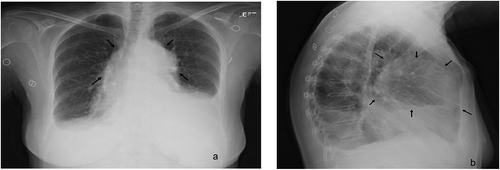
Figure 2. CT chest angiogram in figures 2 (a) and (b) showing mildly lobulated, mildly heterogeneously enhancing anterior mediastinal mass measuring approximately 9.5 × 6.7 x 10.0 cm. The mass label ‘M’ in figures 2 (a) and (b) appears to be compressing a portion of the left pulmonary artery and concerning for massive, compressive thymoma. In figure 2 (c) The thickened pericardium is seen (double-headed arrow) as well as moderate-sized pericardial effusion (single-headed arrows). A mild pleural effusion (*) is seen on the right and a moderate pleural effusion (**) is seen on the left.
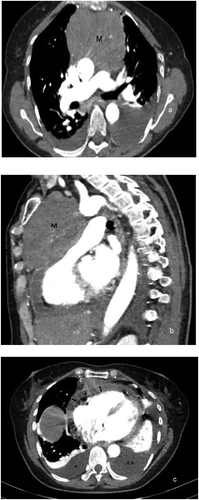
TABLE A1. The Masaoka-Koga staging system [Citation10,Citation13].
Table A2. Thymoma prognosis by Masaoka-Koga staging system [Citation6,Citation10].
Table A3. Thymoma treatment options according to Masaoka-Koga staging system [Citation11].