Figures & data
Figure 1. Risk-adjusted yearly inpatient mortality odds-ratio versus pre-intervention for 5 years on an accountable care unit. Shaded area denotes the period of most intensive unit-level innovation and corresponding risk-adjusted mortality reduction
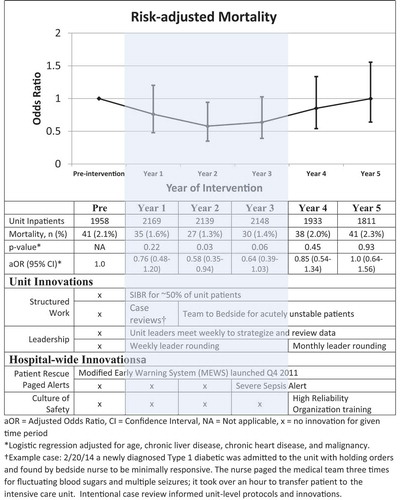
Figure 2. Unexpected deaths among inpatients. Unexpected deaths were those without a documented ‘comfort care’ plan