
Figures & data
Figure 1. Methodology flow diagram of inclusion and exclusion criteria
Table 1. Baseline characteristics of the studied population (n = 94)
Table 2. Mean difference in hemoglobin levels before and after study duration among the groups
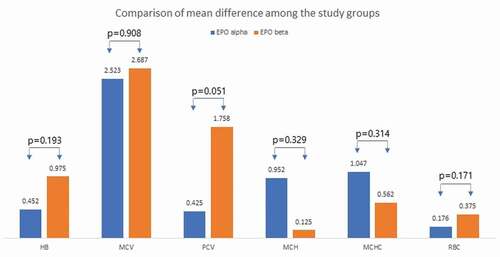
Figure 2. Comparisons of mean differences of studied parameters in both groups before and after completion of therapy
Data availability
Data can be made available upon reasonable request from the corresponding author.