Figures & data
Figure 1. Transmission electron micrograph of vesicles in the 200,000 g supernatant. Ten μg of protein was adsorbed on the grid and negative stained by uranyl acetate. Images were taken at ×40,000 (A and B) and ×50,000 (C and D) magnifications. This magnification was used as in published literature to identify exosomes and exosome-like particles based on their diameter (20–100 nm): exosomes (arrows) and exosome-like vesicles (stars). Figures on the right are enlargements of area of the same field to better visualise the morphology.
Table 1. List of protein identifications unique in SN200 (yellow) and in common with vesicles enriched from other sources and not found in urine (blue).a Protein identifications found only in one replica.
Table 2. Summary of the relative quantification in FLISA (blue), western blot (black), tuneable resistive pulse sensing (TRPS) and ELISA (ExoTESTTM). Values are expressed as percentage of the amount detected in HFDa [HFDa-X/HFDa × 100, where X is either P40 or P200 or SN200]. Red italic values are based on the ratio of the particle number in each fraction to the sum of the particles of all the fractions [HFDa-X/(HFDa-P40 + HFDa-P200 + HFDa-SN200) *100, where X is either P40 or P200 or SN200]. aR&D Systems antibody; bHansaBioMed antibody; cMerck Millipore antibody.
Figure 2. Mass spectrometry analysis. A Venn diagram showing the distribution of the number of identified protein present in the HFD-SN200 (180 gene proteins) with respect to the all human protein found in EVs (8450 gene proteins) and UEVs (4834 gene proteins) in the repository available in Vesiclepedia. Gene ontology classification per cell component of the identified proteins in the UEVs available in Vesiclepedia (B) [Citation33] and HFDa-SN200 (C) according to the Panther classification system (www.panther.org) [Citation35].
![Figure 2. Mass spectrometry analysis. A Venn diagram showing the distribution of the number of identified protein present in the HFD-SN200 (180 gene proteins) with respect to the all human protein found in EVs (8450 gene proteins) and UEVs (4834 gene proteins) in the repository available in Vesiclepedia. Gene ontology classification per cell component of the identified proteins in the UEVs available in Vesiclepedia (B) [Citation33] and HFDa-SN200 (C) according to the Panther classification system (www.panther.org) [Citation35].](/cms/asset/59c125d0-9973-4c5b-b94e-14b68fa70d9e/zjev_a_1267896_f0002_oc.jpg)
Figure 3. SDS-polyacrylamide gel electrophoresis (SDS-PAGE) and western blot (WB) analyses of UEV yield after hydrostatic filtration dialysis (HFD) and differential centrifugation. Ten μg of protein was loaded in each lane and stained with colloidal Coomassie (A). Lane 1 HFDa; Lane 2, HFDa-P40; Lane 3 HFDa-P200 g; Lane 4 HFDa-SN200. Western blots were probed with antibodies against: (B) dipeptidyl dipeptidase 4 (DDP4); (C) Tamm–Horsfall protein (THP); (D) neprilysin (NEP); (E) programmed cell death 6-interacting protein (ALIX); (F) tumour susceptibility gene 101 (TSG101); (G) tetraspanin CD63 (R&D Systems antibody); (H) tetraspanin CD81 (R&D Systems antibody); (I) tetraspanin CD9 (Merck Millipore antibody); (J) tetraspanin CD9 (R&D Systems antibody); (K) Anti ApoA1, (L) β-actin. Molecular weights are expressed in kilo Daltons (kDa).
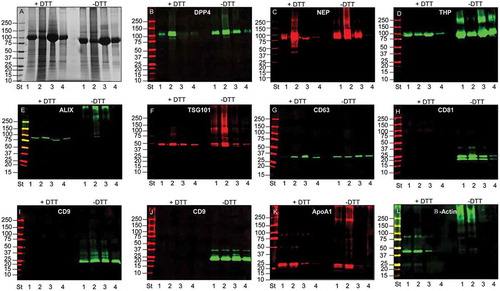
Figure 4. Diagonal SDS-polyacrylamide gel electrophoresis and western blot (WB) analyses of UEV recovered at 40,000 g. Thirty μg of protein was loaded in the first dimension. The gel was stained with colloidal Coomassie (A). Consecutive detection in WB of: (B) β-actin, (C) tumour susceptibility gene 101 (TSG101), (D) dipeptidyl dipeptidase 4 (DDP4); (E) programmed cell death 6-interacting protein (ALIX) in this chronological order. NR: non-reducing (-DTT), R: reducing (+DTT).
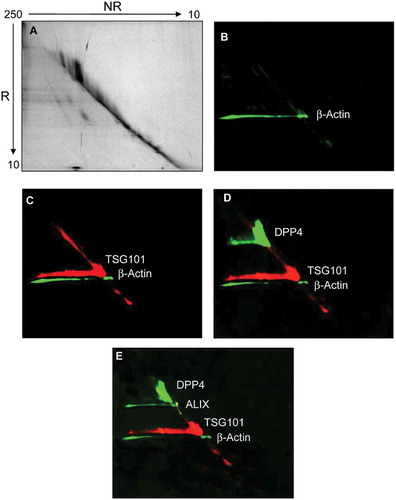
Figure 5. sRNA yield and profile in the differential centrifugation pellets and supernatant. RNA extraction was performed in triplicate (see Supplemental Table 3) and the quantity was assessed by fluorescence assay and referred per ml of HFDa: (A) brown, Norgen RNA isolation kit; green, mirVana™ RNA quality was evaluated using the Agilent 2100 Bioanalyzer using small Chip for HFDa (B,C); HFDa-P40 (D,E), HFDa-P200 (E,F) and HFDa-SN200 (G,H). Norgen RNA isolation kit (B, D, F and H) mirVana™ (C, E, G and I) profiles are representative of triplicate (Supplemental Figures S2 and S3).
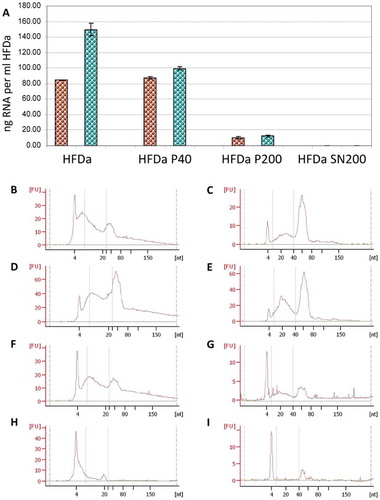
Figure 6. Plots of the fluorescent integrated intensity (I.I.) per ml of HFDa ± standard deviation of vesicles-immobilised FLISA (Supplemental Figure S4) per each fraction obtained from the differential centrifugation protocol. (A) CD9 (green R&D Systems antibody, blue Merck Millipore antibody, red HansaBioMed antibody); (B) CD81; (green R&D Systems antibody, red HansaBioMed antibody); (C) CD63 (green R&D Systems antibody, red HansaBioMed antibody).
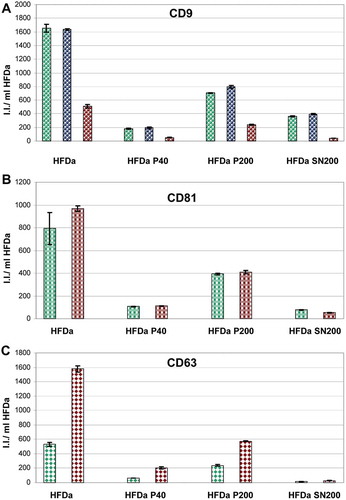
Figure 7. Plots of the fluorescent integrated intensity (I.I.) per ml of HFDa ± standard deviation of three independent western blots (Supplemental Figure S5, S6 and S7) per each fraction obtained from the differential centrifugation protocol. (A,B,C) CD9 (green R&D Systems antibody, blue Merck Millipore antibody, red HansaBioMed antibody); (D,E) CD81; (bright green represent the upper band and green the lower band of R&D Systems antibody, bright red represents the upper band and red the lower ban of HansaBioMed antibody); (F,G) CD63 (lime is the detection of the sample in non-reducing condition (NR) and green is in reducing condition (R) for R&D Systems antibody, dark red HansaBioMed antibody in NR); (H) TSG101 (plum Sigma antibody); (I) Alix (Indigo Thermo Fisher antibody); (J) Rab5 (red HansaBioMed antibody); (K) Flotilin 1 (red HansaBioMed antibody).
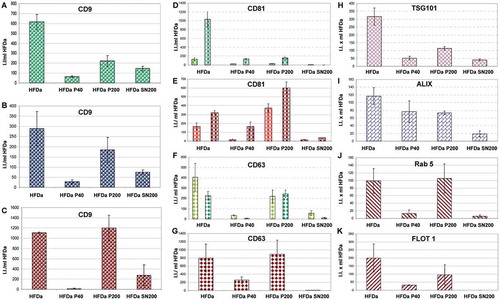
Figure 8. Size distribution of vesicles in HFDa and subfractions. The size distribution of fractionated UEVs was established after calibrating the samples (UEVs) with respect to 100 nm standard particles (CPC100b) at pressure of 4 mbar.
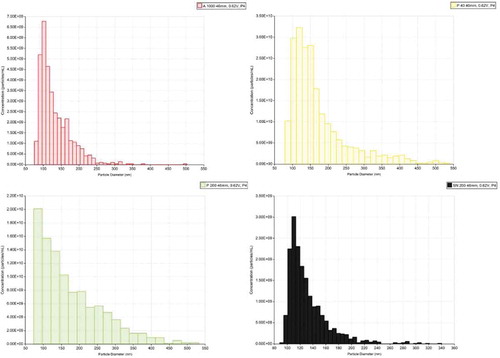
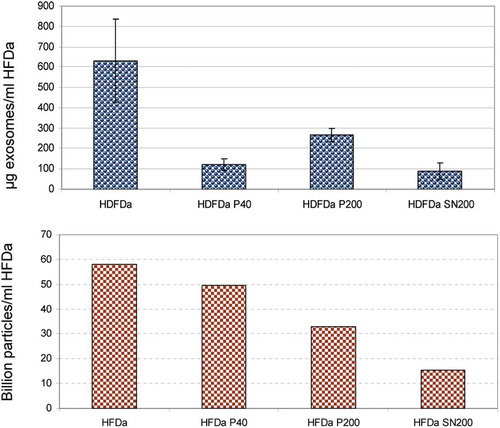
Figure 9. Comparative distribution of exosomes vs particle numbers. Quantification of exosomes by ExoTEST™ ELISA kit (A) and TRPS particle counts based on the multipressure analysis (B) HFDa 5.82 × 10¹⁰, HFDa-P40 4.96 × 10¹⁰, HFDa-P200 3.29 × 10¹⁰, HFDa-SN200 1.54 × 10¹⁰.