
Figures & data
Figure 1. Summary of the MEV isolation approaches. Raw human or bovine milk was skimmed by centrifugation to remove the milk fat globules (MFG) in the cream layer, and to sediment somatic milk cells. Two parallel MEV (milk extracellular vesicle) isolation approaches, based on differential centrifugation and size-exclusion chromatography (SEC), were employed on human and bovine skim milk. (1) Ultracentrifugation of the skim milk (39 ml per tube) results in a solid pellet (340K pellet) containing most of the skim milk casein, a supernatant of milk serum (340K supernatant), and a viscous phospholipid rich soluble concentrate positioned adjacent to the casein pellet (see photo in Sup. Figure S1). The phospholipid concentrate obtained by ultracentrifugation of skim milk is traditionally called the “fluff layer”.[Citation6] (2) A lower g-force centrifugation of human and bovine skim milk (27 ml per tube) results in a casein pellet, and a supernatant of milk serum. Naturally, the casein pellet of human skim milk is smaller compared to bovine skim milk, with the latter depicted in the figure. Subsequently, MEV present in the fluff layer or milk serum can be isolated from remaining soluble casein and whey proteins by SEC. MEV isolation and analysis from the fluff layer is highlighted in red and milk serum in green.
![Figure 1. Summary of the MEV isolation approaches. Raw human or bovine milk was skimmed by centrifugation to remove the milk fat globules (MFG) in the cream layer, and to sediment somatic milk cells. Two parallel MEV (milk extracellular vesicle) isolation approaches, based on differential centrifugation and size-exclusion chromatography (SEC), were employed on human and bovine skim milk. (1) Ultracentrifugation of the skim milk (39 ml per tube) results in a solid pellet (340K pellet) containing most of the skim milk casein, a supernatant of milk serum (340K supernatant), and a viscous phospholipid rich soluble concentrate positioned adjacent to the casein pellet (see photo in Sup. Figure S1). The phospholipid concentrate obtained by ultracentrifugation of skim milk is traditionally called the “fluff layer”.[Citation6] (2) A lower g-force centrifugation of human and bovine skim milk (27 ml per tube) results in a casein pellet, and a supernatant of milk serum. Naturally, the casein pellet of human skim milk is smaller compared to bovine skim milk, with the latter depicted in the figure. Subsequently, MEV present in the fluff layer or milk serum can be isolated from remaining soluble casein and whey proteins by SEC. MEV isolation and analysis from the fluff layer is highlighted in red and milk serum in green.](/cms/asset/4f8be036-1c2a-4723-b5e3-1bf4297283a7/zjev_a_1294340_f0001_oc.jpg)
Figure 2. SEC elution profiles and EV markers in human and bovine fluff and milk serum fractions. SEC (size-exclusion chromatography) profiles of human (a) and bovine (b) fractions were obtained by recording the absorbance at 280 nm. Fractions across the SEC profiles were collected from the fluff (F, in red) and milk serum (S, in green) runs with the eluting peaks annotated with F1–F4 and S1–S5. The solid casein rich pellets derived from the 340,000 g ultracentrifugation (340K pellet) and the 20,000 g centrifugation (20K pellet) were collected and included in the analysis as well as an MFGM preparation. All samples were analysed for their content of lactadherin, CD9, CD63 and CD81 by Western blotting and/or LC-MS. Moreover, human milk SEC fractions were screened for β-casein content by Western blotting, and bovine samples for their content of β-casein, αS1- and αS2-casein by LC-MS. Ten µg protein from the indicated SEC fractions were analysed by Western blotting using antibodies targeting the indicated proteins with their approximated weights shown. Relative levels obtained by LC-MS are based on the detection of peptides specifically derived from the indicated proteins. Abbreviations: MFGM, milk fat globule membrane; LC-MS, liquid chromatography–mass spectrometry.
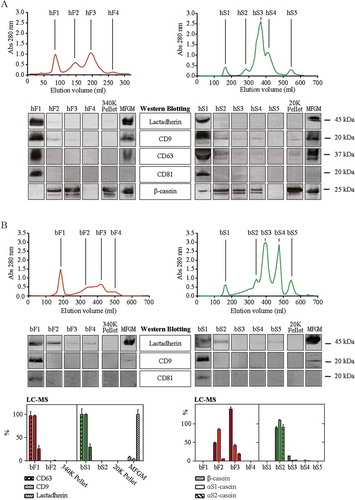
Figure 3. Particle concentration and size by nanoparticle tracking analysis (NTA). (a) Particle concentration in the first SEC peaks of human and bovine fluff (red) and milk serum (green) fractions adjusted to the original volume of milk. (b) Particle size distribution indicated by minimum, mode (●), and maximum particle diameter (nm). All samples were diluted in particle-free PBS, 20 mM EDTA and analysed using the NanoSight NTA system. Five successive measurements were performed on each sample. Minimum concentration for inclusion in minimum and max size in averaged records: 100 particles ml–1. Abbreviations: hF1, human fluff MEV; hS1, human milk serum MEV; bF1, bovine fluff MEV; bS1, bovine milk serum MEV.
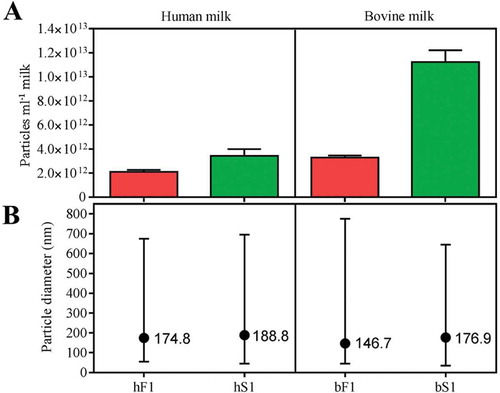
Figure 4. Morphology of MEV isolates by transmission electron microscopy. Freshly prepared MEV isolates from pooled fractions of the first SEC peaks were stained with a 1% uranyl formate solution and imaged in the concentration they were eluted from the column. Abbreviations: SEC, size-exclusion chromatography; hF1, human fluff MEV; hS1, human milk serum MEV; bF1, bovine fluff MEV; bS1, bovine milk serum MEV.
Figure 5. Lipid profiles of milk membrane fractions by TLC. Crude lipids were extracted from the indicated milk membrane fractions using a chloroform:methanol solution. hF1 and hS1 were isolated from milk donated by different mothers. Phospholipids and neutral lipids in crude lipid extracts were separated by high performance thin layer chromatography (TLC) together with representative lipid standards. The ratios of distinct lipid bands were evaluated by a fluorescent stain and normalised to the lipid standards. (a) Phospholipid profiles of human and bovine MEV and MFGM preparations. (b) Triacylglyceride (TAG):cholesterol ratio of MEV, MFGM, and milk fat globule (MFG) preparations. Abbreviations: hF1, human fluff MEV; hS1, human milk serum MEV; bF1, bovine fluff MEV; bS1, bovine milk serum MEV; bMFGM, bovine milk fat globule membrane; bMFG, bovine milk fat globule; hMFGM, human milk fat globule membrane; hMFG, human milk fat globule.
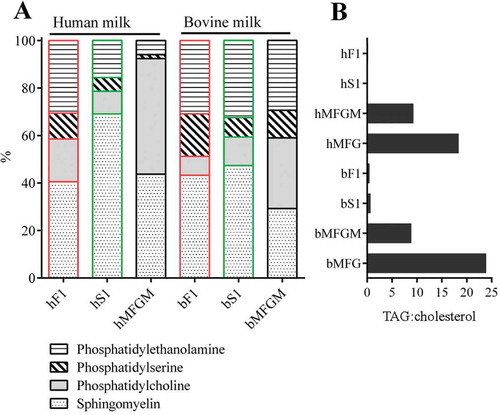
Figure 6. MEV sucrose density analysis. The first SEC peak enriched in either fluff or Serum MEV was concentrated by reverse osmosis and applied on the top of a sucrose gradient. The MEV loaded gradients were ultracentrifuged over night at 164,000 g for 18 hours. Fractions were drawn from the top, and their density determined using a densitometer. The fractions were diluted 10 times in PBS and ultracentrifuged at 100,000 g for 70 min to pellet the MEV content. The pellets were analysed for their content of the indicated markers by Western blotting. Abbreviations: hF1, human fluff MEV; hS1, human milk serum MEV; bF1, bovine fluff MEV; bS1, bovine milk serum MEV.
Figure 7. Total RNA profiles for human and bovine MEV and cream fractions. Total RNA contained in fluff (red) and serum (green) MEV fractions were isolated from SEC F1/S1 peaks concentrated by reverse osmosis. Cream was sampled from the first centrifugation of raw milk. RNA extracts were analysed on Agilent RNA 6000 Pico chips using an Agilent Bioanalyzer. The total MEV RNA content was related to the initial start volume of milk (ng ml–1 milk). The peak at 25 nt is an internal standard. Abbreviations: FU, fluorescence units; nt, nucleotides; hF1, human fluff MEV; hS1, human milk serum MEV; bF1, bovine fluff MEV; bS1, bovine milk serum MEV.
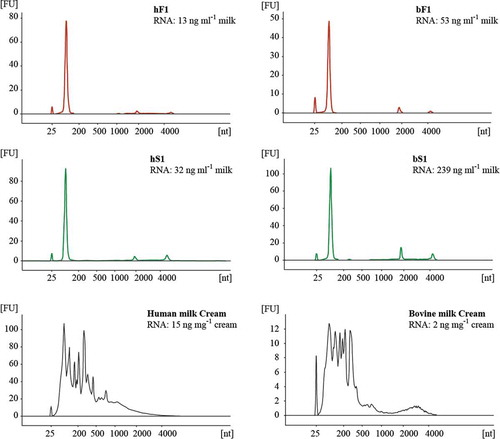
Table 1. Quantitative data on MEV isolation yield. MEV protein yields are averaged from n-number of isolations. MEV particle yields from nanoparticle tracking analysis (). MEV RNA yields averaged from measurements performed in technical triplicate ().