Figures & data
Figure 1. Schema for large-scale propagation and isolation of aNK cell-derived extracellular vesicles. (a) Schema for isolation of EVs from 48-h conditioned medium of activated NK (aNK) cells. The flow chart for EV isolation using NK cells expanded ex vivo and our PEG8000 precipitation method is shown. The detailed procedure is described under Materials and methods. The procedure is divided into three steps: first, ex vivo expansion of NK cells through the use of IL-2 and of artificial antigen presenting cell K562 with membrane bound IL21. The EVs were harvested from the aNK cell culture on day 21. The collected culture supernatant was filtered and precipitated by PEG8000 (Figure S1(a)). The pellet was suspended and dialysed in PBS-5% glycerol with a cut-off size of 100 KDa. The resulting EVs are cytotoxic and cryo-stable for one year at −80°C (Figure S1(b)). The EVs can be further purified by density gradient centrifugation or other methods. (b) aAPC selectively propagate NK cells in co-culture. The CD56 and CD16 positive cells represent NK cells, resulting in 95% aNK cells on day 19 (n = 25). (c) Nanoparticle tracking analysis of EVs. Aliquots of isolated aNK EVs were diluted 1:100 in PBS and analysed using a Nanosight NS300 in light scatter mode. The NTA software defined the number and size range of the vesicles within the sample, plotting the particle size versus particle number per ml. A representative chart of the mean particle size at 155 nm (top) and an image of light reflective particles (bottom) are shown.
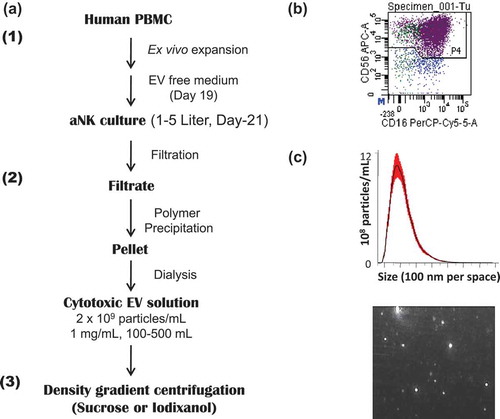
Figure 2. Markers and TEM image of isolated aNK extracellular vesicles. (a) Western blot analysis of isolated EVs and their parental cells. Thirty μg protein were loaded in each lane and probed with antibodies to CD63 (GeneTex, GTX37555, 1:500), Rab5A (Aviva Systems Biology, ARP56563-P050), cytochrome C (Santa Cruz Biotech, sc-13560, 1:500), granulysin (Antibodies-online, Inc. ABON1107438, 1:500), CD56 (EMD Millipore, MAB2120Z, 1:500). For fibronectin, only 5 μg of protein was loaded (GeneTex, GTX72724, 1:1,000). The un-cropped images with size markers are shown in Figure S2. (b) Transmission electron microscopy of EVs. aNK EVs were isolated as described in . Aliquots of samples were subjected to TEM imaging as described in Materials and methods. A representative image is shown. Bar: 200 nm
Figure 3. Size comparison of isolated extracellular vesicles from different cancer cell lines. Nanoparticle tracking analysis was performed to compare the sizes of EVs isolated from different cell lines. All cell lines were grown in RPMI medium with 10% FBS until log phase. Cell media were replaced with 10% exosome-free FBS with cells at a density of 0.5 × 10⁶ ml–1. After 48 h, the culture supernatants were filtered, PEG8000-precipitated, dialysed, and suspended in one-tenth of the original volume of PBS containing 10% glycerol. The resulting EV preparations were subjected to nanoparticle tracking analysis. Dot plot were graphed with statistical software GraphPad Prime version 6.0 from five readings of samples prepared by ultracentrifugation (Ↄ) or PEG precipitation (□) side by side from different cell lines. CHLA-255, CHLA-136, SK-N-BE2, IMR-32 are neuroblastoma cell lines; H2228 is a non-small cell lung cancer adenocarcinoma cell line; HEK293 is a kidney embryonic cell line; and IMR-90 cells are normal fibroblasts.
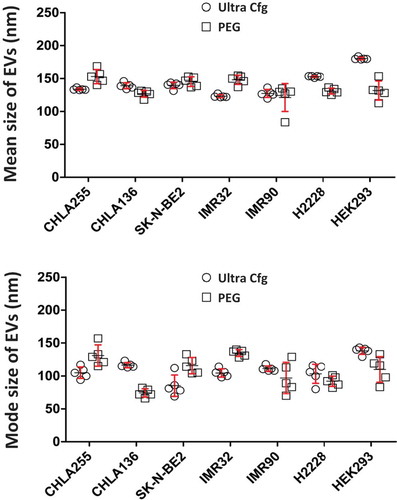
Figure 4. Cytotoxicity of isolated aNK extracellular vesicles. Luciferase assay. EVs were isolated from 48 h conditioned medium of aNK cells as in . ALL SupB15-fLuc cells (104 cells) or neuroblastoma CHLA255-fLuc cells (104 cells) were incubated in 96-well plates with aNK cells (104 cells; effector:target cell ratio 1:1) (columns 1 and 5) as the positive control, or different amounts of purified exosomes as indicated. After 6 h incubation, the luciferase substrate Beetle Luciferin (Promega, E1605) was added, and bioluminescence was quantified. Untreated samples were designated as 100% survival for CHLA255-fLuc or SupB15-fLuc (lanes 2 or 6, respectively) and results were expressed as per cent survival. fLuc: firefly luciferase labelled cells. *p < 0.05, **p < 0.01 (a) Acridine orange/propidium iodide fluorescence assay: 104 cells (SupB15 or CHLA-255) from log phase cell culture were transferred to 96-well dark plates in the presence (∎, solid line) or absence (△, dotted line) of EVs (40 μg) in a final volume of 100 μl. Similarly, 40 μg EVs isolated from neuroblastoma CHLA-255 cells was used as the negative control (⋄, solid line). The suspensions were incubated at 37°C, and the percentage of dead cells was calculated by the LUNA cell counter at various times (0, 6, 12, 24 h). (b) The acridine orange/propidium iodide fluorescence assay was performed using different cancer cell lines, as indicated. The percentage of dead cells, without (light box) or with EVs (40 µg) (grey box), was determined by the LUNA cell counter at 24 h. The error bars on the graphs are generated by the Excel software based on 4–8 readings in each test. *p < 0.05, **p < 0.01.
Figure 5. aNK extracellular vesicles contain cytotoxic proteins. A 0% to 45% iodixanol continuous density gradient centrifugation was performed. Samples were loaded in duplicate ultracentrifuge tubes. After centrifugation at 100,000 × g for 3 h, nine iodixanol fractions were collected from the top. The density of each fraction was determined from two balanced tubes, as shown in (a). The total protein content represents the average of each fraction (b). Fractions were analysed by Western blotting (c) using antibodies to CD63 (BD Bioscience, H5C6) under non-reducing condition, PFN (perforin), granulysin (GNLY), granzyme A (Gzm-A), granzyme B (Gzm-B), and fibronectin (FN). The arrow points to fraction 7, which has a density of 1.08–1.12 g ml–1 and contains most of the analysed proteins. The un-cropped images with size markers are shown in Figure S3.
Table 1. Size comparison of aNK extracellular vesicles obtained by different isolation methods. aNK cell supernatant (150 ml) obtained from exosome-free culture was divided into three parts, and aNK EVs were isolated with three methods. The resulting EV preparations were recovered in a volume of 5 ml, and aliquots of samples were analysed by nanoparticle tracking analysis to determine their size and particle concentrations. Analysis of cell culture medium (non-conditioned) is also shown.
Table 2. Nanoparticle tracking analysis of isolated extracellular vesicles by polymer precipitation method from various cell lines. All cell lines were grown in RPMI medium, except D54MG in Ham’s F-12, MCF7 in DMEM, and DU145 in IMDM, with 10% FBS until log phase. Cell media were replaced with 10% exosome-free FBS and plated at a density of 0.5 × 10⁶ cells ml–1. After 48 h, the culture supernatants were prepared and subjected to nanoparticle tracking analysis.
Figure 6. Caspase inhibitors partially block aNK extracellular vesicle-induced cytotoxicity. Neuroblastoma CHLA-255 cells (top panel) or ALL NALM-6 cells (bottom panel) were pre-incubated with different caspase inhibitors (100 μM) for 30 min, prior to the addition of aNK EVs. The AO/PI cytotoxicity assay was performed as described in Materials and methods. The inhibitors alone had no effect on these cells. After 24 h, the percentage of dead cells was calculated by the LUNA Cell Counter. The percentage of dead cells under different treatments are shown (N = 6; *p < 0.05, **p < 0.01). The error bars on the graphs are generated by Excel software, based on 4–8 readings in each test. Independent testing of caspase inhibitors 3, 8, 10, and 12 by Annexin V flow cytometry is shown in Figure S4.
Figure 7. Activation of caspases in target cells by aNK extracellular vesicles. ALL NALM-6 cells were treated with aNK EVs for different time points as indicated. Cells were then harvested and lysed in SDS-PAGE sample buffer. Each lane contains 30 μg cell lysate proteins as determined by the Orbit® protein assay (Life Technologies). Antibodies against cleaved caspase -3, -7, and -9, and PARP from the Cleaved Caspase Antibody Sampler Kit were used to probe the blots according to the manufacturer’s protocol. β-Actin was used as the loading control. The un-cropped images with size markers are shown in Figure S5.