Figures & data
Figure 1. EV isolation and characterisation. (a) Microvesicles (MVs) and exosomes (EXOs) were isolated from the culture medium using differential centrifugation. (b) Western blot was performed on cell, MVs and EXOs by analysing the same amount of proteins. PDCD6IP was used as a marker for EVs, and GRP94 as a negative control for EXOs. (c) Size distribution of the two subsets. The average was calculated from five different measurements and plotted (line) together with the standard deviation (SD) (area). (d) Electron microscopy analysis of EVs. Scale bar represents 100 nm.
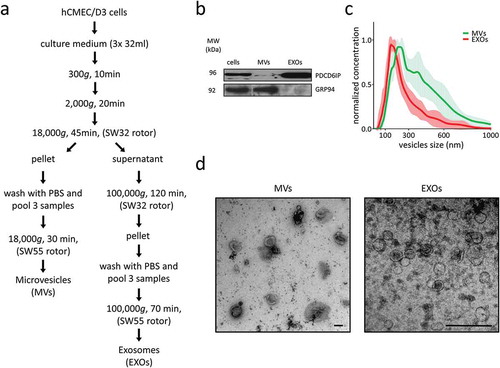
Figure 2. (a) Workflow overview. (b) Venn diagrams displaying the total number of proteins identified in cells, MVs and EXOs (≥ 2 peptides). Complete list of all identified proteins is found in Supplementary Table 1.
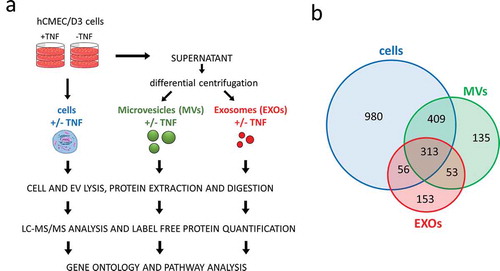
Figure 3. Heat maps displaying significant (p < 0.01) GO terms for biological processes and cellular components. GO terms were functionally grouped based on kappa scores and only the most significant GO terms were displayed. The significance of each GO term was displayed as -log10 (p-value).
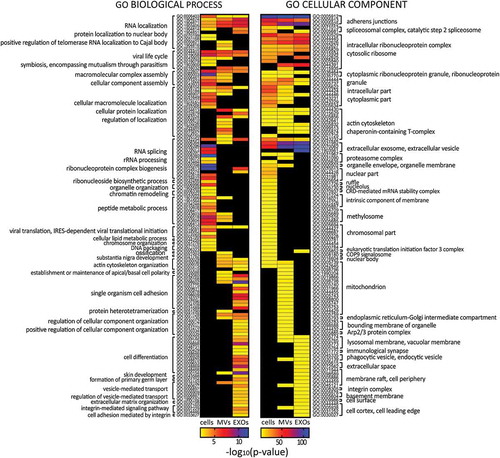
Figure 4. (a) Venn diagram displaying differentially expressed proteins after exposure to TNF in different samples: cells, MVs and EXOs. For detailed list see Supplementary Table 2. (b) Comparison of the fold-change (FC) of proteins found to be significantly up- or downregulated after exposure to TNF (p < 0.01, |FC|> 1.5) in both cells and EVs. The significant IPA canonical pathways enriched in cell (c), MV (d) and EXO (e) samples. The significance (–log10 (p-value)) for each pathway are displayed. (f) Heat map showing the results of the IPA upstream regulator analysis.
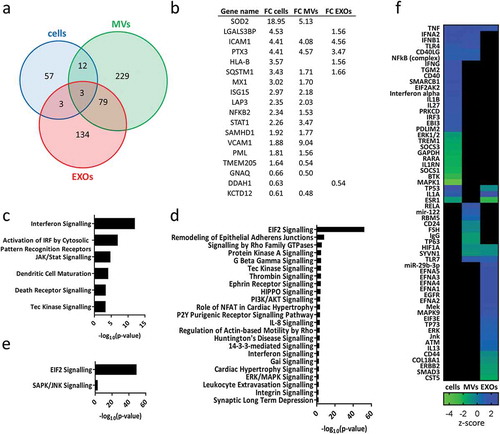
Figure 5. PRM analysis of selected proteins enriched in EXOs (PDCD6IP, CD81, CD9, SDCB1) or in MVs (SEPT2, RACGAP1, ATP5A1). Average abundances were displayed with standard deviations.
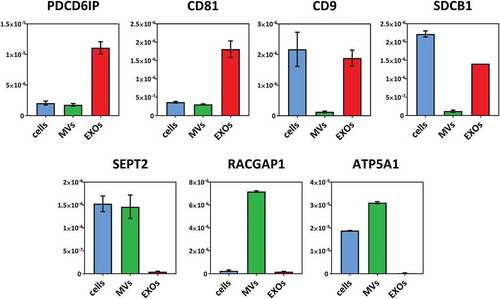
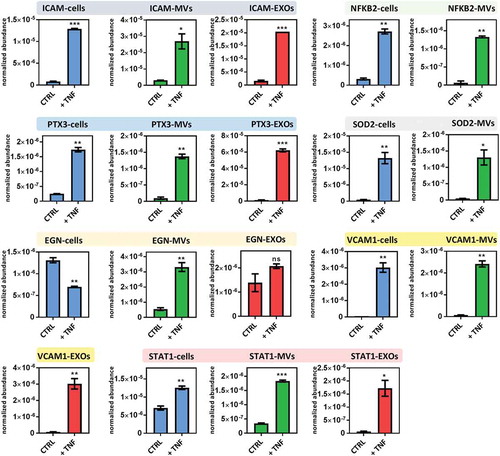
Figure 6. PRM analysis of proteins found differentially expressed in cells, MVs and EXOs after exposure to TNF. Average abundances were displayed with standard deviations. Asterisks indicate significance levels: ***p < 0.001, **p < 0.01, *p < 0.05.