Figures & data
Figure 1. 3T3-L1 adipocytes secrete distinct extracellular vesicle (EV) subpopulations: large extracellular vesicles (lEVs) and small extracellular vesicles (sEVs). (A) Schematic representation of the successive differential centrifugation steps used to isolate the EV subpopulations released by mature 3T3-L1 adipocytes. Total EVs and EV subtypes, namely lEVs and sEVs, were isolated from 24 h serum-deprived 3T3-L1 culture media (CM) after the removal of cells and cell debris. (B) EV production based on protein content of EV subtypes. The protein content of each EV pellet normalised to the protein content of the original productive 3T3-L1 adipocytes is presented. n = 3–9 independent EV preparations, **p < 0.01 (Mann–Whitney rank test). (C,D) Transmission electron microscopy images of lEV (C) and sEV (D) pellets. Note that scale bars differ between images (left images, scale bars = 200 nm; right images, scale bars = 100 nm). (E–H) Nanoparticle tracking analysis of lEV and sEV populations. Determination of size distribution and concentration of lEV (E) and sEV (F) preparations. Indicated concentrations refer to the initial concentration of EVs in the conditioned media from which they were isolated and are expressed as 104 particles/mL. Each coloured line represents the mean of five videos acquired for a single biological sample. EV mean size (G) and EVs released per cell (H) are presented. The same colours as in (E) and (F) are used to distinguish the four different lEV/sEV preparations analysed. lEV pellets contained vesicles of larger size than sEV pellets. 3T3-L1 adipocytes secrete substantially more sEVs than lEVs in serum-deprived conditions. n = 4 biological samples for lEVs and for sEVs, *p < 0.05 (Mann–Whitney rank test).
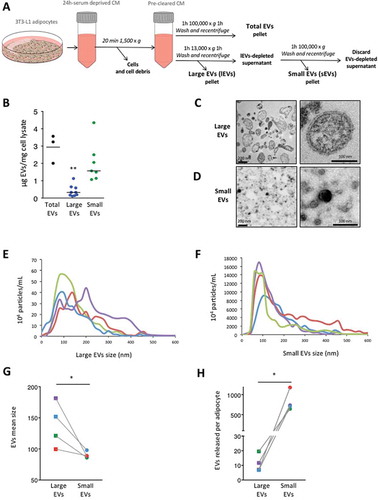
Figure 2. Adipocyte-derived large extracellular vesicles (lEVs) and small extracellular vesicles (sEVs) differentially carry classical extracellular vesicle (EV) markers and display different flotation behaviours on sucrose gradients. (A) Western blot analysis of different EV markers in EV subpopulations isolated from adipocytes. The different centrifugation pellets, including either total EVs or lEVs and sEVs, were resuspended in NaCl and quantified for their protein content. lEVs (13,000 × g pellet) and sEVs (100,000 × g pellet) were collected from the same batch of cells cultured in the same conditions (see Methods). Eight micrograms of total adipocyte-derived EVs (EVs), lEVs or sEVs was loaded on a sodium dodecyl sulphate–polyacrylamide gel electrophoresis (SDS-PAGE) gel, together with 8 µg of original adipocyte cell lysate (CL), and analysed by immunoblotting for the presence of the following proteins: Alix, Mfge8, the tetraspanins CD63, CD81 and CD9, TSG101, flotillin-2, β-actin and caveolin-1. Ten micrograms of EVs and CL were specifically loaded to allow detection of β-actin in the total EV sample. One representative blot for each protein is presented. (B) Quantification of the distribution of the different EV markers between lEVs and sEVs, analysed by Western blot. At least three independent preparations of lEVs and sEVs were analysed for the presence of the EV markers by Western blot, following equal protein loading (8 µg). For each protein analysed, the signal intensity (SI) of the protein signal band was calculated using ImageJ software, as follows: AUlEVs = (SIlEVs)/(SIlEVs + SIsEVs) and AUsEVs = (SIsEVs)/(SIlEVs + SIsEVs). Each colour represents an independent experiment, with lEV and sEV preparations derived from the same secreting cells. *p < 0.05 (paired Student’s t test), **p < 0.01, ****p < 0.0001. (C,D) Separation of lEV (C) and sEV (D) preparations on sucrose gradients. Equivalent protein amounts of lEVs and sEVs (120 µg) resuspended in 500 µL NaCl were loaded on to a sucrose gradient (2.0 M to 0.4 M). Collected sucrose fractions were recentrifuged, resuspended in phosphate-buffered saline and divided into two portions, to be loaded on SDS-PAGE in either reducing or non-reducing conditions, the latter gel being used for tetraspanin detection. The density of the collected sucrose fractions was determined by a refractometer and is indicated above the gel. lEV- and sEV-derived sucrose density fractions were probed with the following EV markers: Alix, Mfge8, CD63, CD9 and β-actin. lEV pellets were found to float mainly at densities between 1.20 and 1.22 g/mL, according to Mfge8, caveolin-1, flotillin-2 and CD63 signals (C). Alix was undetectable in this lEV-separated sucrose gradient. By contrast, sEV pellets were recovered at lower densities, between 1.14 and 1.20 g/mL, as illustrated by Alix, Mfge8, CD63 and CD9 signals (D).
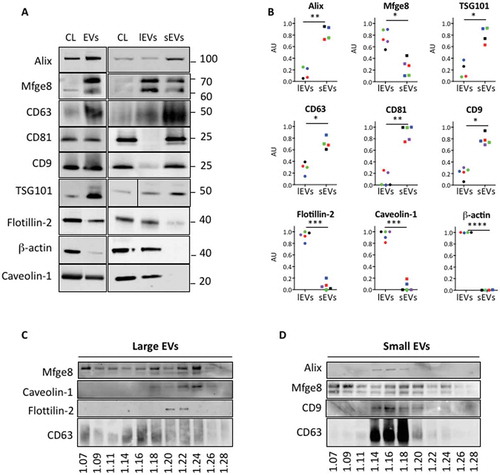
Figure 3. Proteome characterisation by nano-liquid chromatography–tandem mass spectrometry (LC-MS/MS) analysis reveals the specific protein signature of extracellular vesicle (EV) subpopulations. (A) Venn diagram of the identified proteins in total EV, large extracellular vesicle (lEV) and small extracellular vesicle (sEV) populations. Proteins were considered identified when at least two peptides were detected in at least two of the four biological replicates. The important overlap between total EV and sEV proteomes underlines the ability of 3T3-L1 adipocytes to secrete abundant sEVs, in comparison to lEVs, in serum-deprived culture conditions. (B) Principal component analysis (PCA) of EV subpopulations underlines the distinct protein composition between sEV and lEV fractions. Results are shown for the four independent adipocyte-derived EV biological preparations (total EVs, lEVs and sEVs) analysed by nano-LC-MS/MS analysis. PCA of identified proteins for each EV subtype shows a clear separation of lEVs from sEVs and total EVs. (C–E) Gene ontology (GO) terms of protein families enriched in lEV and sEV preparations. Identified proteins in lEV and sEV fractions, respectively, were classified according to cellular component (C), biological process (D) and molecular function (E) categories defined by the GO consortium using the Panther classification system database. (C) Cellular component GO analysis reveals an enrichment of membrane and organelle components for lEVs, and in the extracellular region and extracellular matrix for sEV. (D,E) GO categories with greater than five-fold enrichment are presented for lEV and sEV populations following classification according to biological process (D) or molecular function (E). The [–log(P)] is shown for each category indicated, where P is the significance. The dotted line represents the threshold (P = 0.01) over which the represented categories display a significant five-fold greater enrichment than expected by chance.
![Figure 3. Proteome characterisation by nano-liquid chromatography–tandem mass spectrometry (LC-MS/MS) analysis reveals the specific protein signature of extracellular vesicle (EV) subpopulations. (A) Venn diagram of the identified proteins in total EV, large extracellular vesicle (lEV) and small extracellular vesicle (sEV) populations. Proteins were considered identified when at least two peptides were detected in at least two of the four biological replicates. The important overlap between total EV and sEV proteomes underlines the ability of 3T3-L1 adipocytes to secrete abundant sEVs, in comparison to lEVs, in serum-deprived culture conditions. (B) Principal component analysis (PCA) of EV subpopulations underlines the distinct protein composition between sEV and lEV fractions. Results are shown for the four independent adipocyte-derived EV biological preparations (total EVs, lEVs and sEVs) analysed by nano-LC-MS/MS analysis. PCA of identified proteins for each EV subtype shows a clear separation of lEVs from sEVs and total EVs. (C–E) Gene ontology (GO) terms of protein families enriched in lEV and sEV preparations. Identified proteins in lEV and sEV fractions, respectively, were classified according to cellular component (C), biological process (D) and molecular function (E) categories defined by the GO consortium using the Panther classification system database. (C) Cellular component GO analysis reveals an enrichment of membrane and organelle components for lEVs, and in the extracellular region and extracellular matrix for sEV. (D,E) GO categories with greater than five-fold enrichment are presented for lEV and sEV populations following classification according to biological process (D) or molecular function (E). The [–log(P)] is shown for each category indicated, where P is the significance. The dotted line represents the threshold (P = 0.01) over which the represented categories display a significant five-fold greater enrichment than expected by chance.](/cms/asset/ff89f3be-2c21-4faf-97dc-4d46b5ab1ded/zjev_a_1305677_f0003_oc.jpg)
Table 1. Proteins specifically enriched in large extracellular vesicle (lEV) preparations.
Table 2. Proteins specifically enriched in small extracellular vesicle (sEV) preparations.
Figure 4. Validation of proteomics data and identification of specific markers of large extracellular vesicles (lEVs) and small extracellular vesicle (sEVs). (A,B) Western blot analysis of selected proteins identified by the quantitative analysis of proteomic data. Equal amounts of protein (8 µg) for lEVs or sEVs were loaded on a sodium dodecyl sulphate–polyacrylamide gel electrophoresis gel and immunoblotted for selected proteins found to be enriched in either lEV or sEV preparations, based on the statistical analysis of quantitative proteomic data. For each selected protein, a representative immunoblot is presented. Quantifications of signal intensity are represented as dot plots and calculated from three to seven independent experiments as described in (B). The colours used represent different biological replicates used for the immunoblots. These results were confirmed by immunoblotting the specific enrichment of ap2/FABP4, 14-3-3, annexin A2 and endoplasmin in lEV fractions, whereas adiponectin, major vault protein (MVP) and FAS are specifically enriched in sEV fractions. (C,D) Western blot of actinin-4 (C) and syntenin-1 (D) in lEV and sEV subpopulations. Actinin-4 is found to preferentially associate with lEVs, whereas syntenin-1 expression is equally distributed in lEV and sEV preparations.
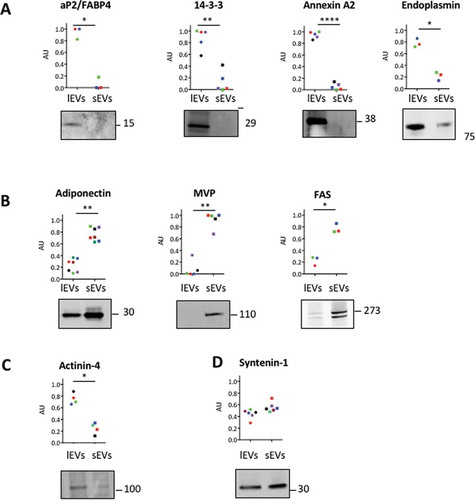
Figure 5. Lipidomic characterisation of large extracellular vesicles (lEVs) and small extracellular vesicles (sEVs) by liquid chromatography–tandem mass spectrometry (LC-MS/MS). (A) The total amount of lEV and sEV membrane lipids as determined by LC-MS/MS is expressed in micrograms normalised to the amount of extracellular vesicle (EV) protein content. The term phospholipids represents the sum of phosphatidylcholine (PC), phosphatidylethanolamine (PE), phosphatidylinositol (PI) and phosphatidylserine (PS). Sphingolipids include ceramides (Cer), glycosylceramides (GlyCer) and sphingomyelin (SM). Glycerolipids are uniquely represented by diacylglycerols (DGs). Data presented for each lipid concentration represent the mean of four individual lEV and sEV preparations each. (B) Composition of lEV and sEV membrane lipids according to lipid classes. Data are expressed as a percentage of the total lipid content determined for each statistical group and represent the mean of four individual lEV and sEV preparations each. See (A) for definitions of each lipid species. (C) sEV preparations are specifically enriched in cholesterol. The cholesterol content was measured in isopropanol-resuspended EV membrane lipids using a colorimetric assay. The total amount of cholesterol measured is expressed in micrograms normalised to the amount of EV protein content. n = 5–8 biological samples for lEVs and for sEVs, *p < 0.05 (Mann–Whitney rank test). (D) Measurement of annexin V positivity of adipocyte-derived lEVs and sEVs by flow cytometry. High annexin V binding of adipocyte-derived lEVs illustrates a higher proportion of externalised PS in lEVs than in sEV preparations. n = 3 independent lEV and sEV preparations, *p < 0.05 (paired Student’s t test)
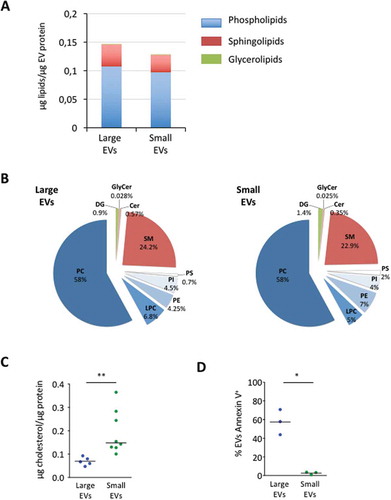
Figure 6. Large extracellular vesicle (lEV) and small extracellular vesicle (sEV) secretion following exposure to external stimuli. (A,B) Nanoparticle tracking analysis quantification of lEV (A) and sEV (B) secretion following 24 h treatment of 3T3-L1 matures adipocytes in serum-deprived conditions with the following stimuli: bovine serum albumin-conjugated oleic or palmitic acid (OA or PA, 500 µM each), 8-bromoadenosine 3’,5’-cyclic monophosphate (8-Br-cAMP) (1 µM), ionomycin (Iono, 1.5 µM), angiotensin II (AngII, 10 nM), interferon-γ (INFγ, 100 U/mL corresponding to 5 ng/mL and tumour necrosis factor-α (TNFα, 10ng/mL. Extracellular vesicles secreted per adipocyte are represented as dot plots and calculated from three to five independent experiments. *p < 0.05, **p < 0.01 (Mann–Whitney rank test).
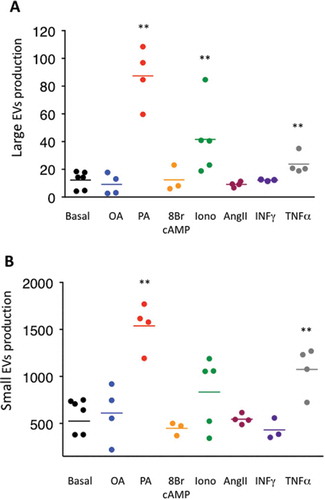
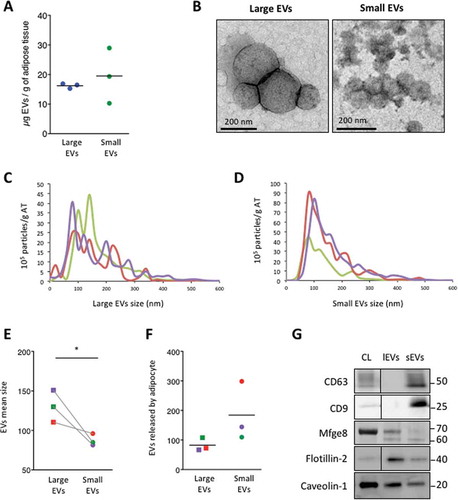
Figure 7. Primary adipocytes secrete large extracellular vesicles (lEVs) and small extracellular vesicles (sEVs), compared to 3T3-L1 adipocytes. (A) Primary adipocyte-derived extracellular vesicle (EV) production based on protein content of EV subtypes. The protein content of each EV pellet per gram of dissected adipose tissue is presented. Similar production of lEVs and sEVs was measured. n = 3 independent EV preparations. (B) Transmission electron microscopy images of lEV and sEV pellets. Scale bars = 200 nm. (C–F) Nanoparticle tracking analysis of lEV and sEV populations. Determination of size distribution and concentration of lEV (C) and sEV (D) preparations. Indicated concentrations refer to the concentration of EVs secreted per gram of dissected adipose tissue and are expressed as 105 particles/g adipose tissue. Each coloured line represents the mean of five videos acquired for a single biological sample. EV mean size (E) and EVs released per cell (H) are presented. The number of isolated adipocytes from dissected fat pads was indirectly estimated, as described in the Methods section. The same colours are used in C–F to distinguish the three different lEV/sEV preparations analysed. lEV pellets contained larger vesicles than sEV pellets. Primary adipocytes secrete equal amounts of sEVs and lEVs when cultured in serum-deprived conditions. n = 3 biological samples for lEVs and for sEVs, *p < 0.05 (Mann–Whitney rank test). (G) Western blot analysis of different EV markers in EV subpopulations isolated from primary adipocytes: 8 µg of either lEVs or sEVs was loaded on a sodium dodecyl sulphate–polyacrylamide gel electrophoresis gel, together with 8 µg of original adipocyte cell lysate (CL), and analysed by immunoblotting for the presence of the following proteins: CD9, CD63, Mfge8, flotillin-2 and caveolin-1. A black line was inserted on the immunoblots when samples were loaded on the same gel, but not side by side. One representative blot for each protein is presented.