Figures & data
Figure 1. Comparison between ultracentrifuge and Vn96-peptide for urinary EV isolation. (a) Schematic overview of urinary EV isolation between ultracentrifuge and the easier and shorter protocol by using the Vn96-peptide. Of the ultracentrifuge EV sample 100% was used for LC-MS/MS analysis, while for the Vn96-peptide 45% was used for LC-MS/MS analysis. Both isolation methods resulted in a comparable number of identified proteins by LC-MS/MS and total spectral counts. (b) Representative western blot (of n = 3) showing the effect of 50 and 100 µg of the Vn96-peptide and the abundancy of PDCD6IP and TSG101. UC = ultracentrifuge, unbound indicates isolated EVs from supernatant after isolation with VN96-peptide. (c) Venn diagram comparing the identified proteins in urinary EVs isolated by ultracentrifugation between our study and data available from others Citation15,Citation16. (d) Venn diagram indicating the number of overlapping proteins between exosomes isolated using the ultracentrifuge and VN96-peptide. Shown proteins were identified in at least 3 of the 4 patients in each group.
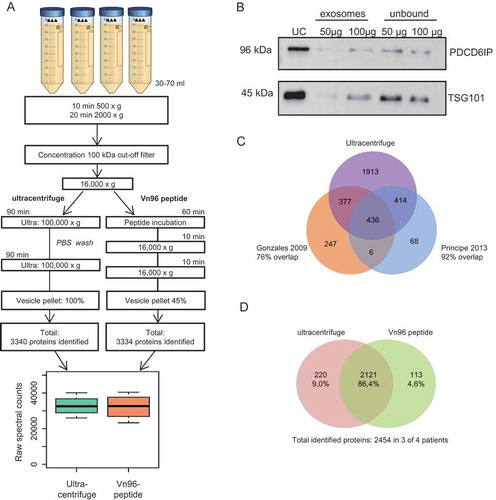
Figure 2. Comparison of identified proteins between ultracentrifuge and Vn96-peptide by LC-MS/MS. (a) Venn diagrams showing the identified proteins in ultracentrifuge and Vn96-peptide within urinary EVs from the same donor. (b) Correlation analysis of proteins identified in urinary EVs isolated by ultracentrifuge compared to Vn96-peptide (kit). (c) Bar graph showing the abundancy of 7 EV protein markers in urinary EVs isolated by ultracentrifuge and Vn96-peptide. Spectral counts for the Vn96-peptide were corrected for 45% input in the measurement, and show a comparable abundancy of each proteins within the samples. (d) Comparative analysis showing the cellular component enrichment of identified proteins. Most identified proteins were related to exosomes, lysosome and extracellular proteins.
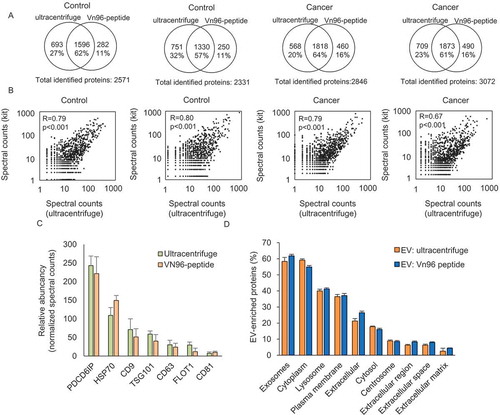
Figure 3. Effect of addition of NP40 to urinary EVs. (a) Western blot showing an increased expression of PDCD6IP and TSG101 after addition of increasing concentrations of the detergent NP40 during EV isolation. (b) Western blot showing that further increasing the concentration of NP40 does not lead to a further increase in the expression of PDCD6IP and TSG101. (c) Schematic overview of the proteomics workflow of isolating EVs and boxplot showing the total raw spectral counts. (d) Correlation analysis of proteins identified using LC-MS/MS in urinary EVs isolated by the Vn96-peptide (kit) or the Vn96-peptide with addition of 0.05% NP40. (e) Bar graph showing the abundancy of 7 EV-markers between the EVs isolated by ultracentrifuge, VN96-peptide and Vn96-peptide + 0.05% NP40. (f) Enrichment of non-EV related proteins and EV-related proteins after addition of NP40, showing a small reduction in several background proteins, and an increase in EV-markers.
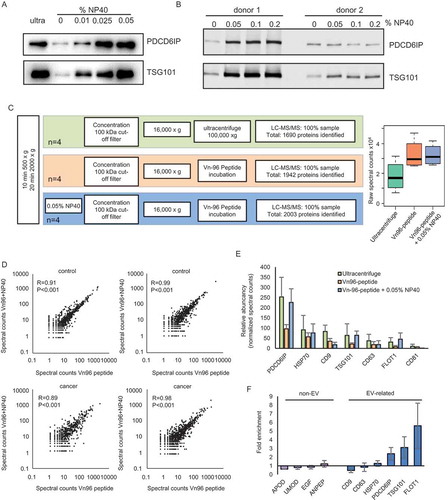
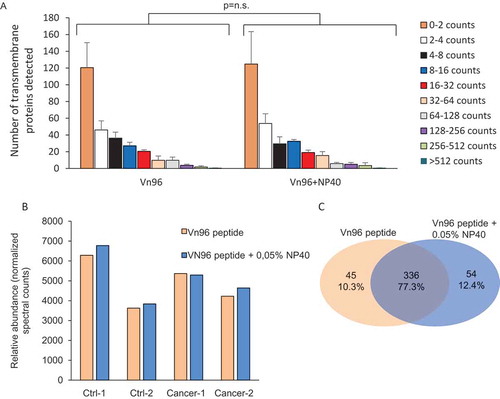
Figure 4. Effect of NP40 on the abundancy of predicted transmembrane proteins. (a) Effect of 0.05% NP40 on the detection of predicted transmembrane proteins showing no effect on the number of proteins identified in any of the abundancy classes. (b) Effect of NP40 on the total normalised spectral counts of the total of transmembrane proteins. (c) Venn diagram of transmembrane proteins in Vn96-peptide with and without NP40.