
Figures & data
Figure 1. Cerebrospinal fluid (CSF) study design. Pools of CSF were generated for six diagnostic groups (five to 12 subjects/group): neurologically normal subjects (Control) from University of California, San Diego (UCSD); neurodegenerative disease [Alzheimer’s disease (AD) and Parkinson’s disease (PD)] from Oregon Health & Science University (OHSU); central nervous system tumour [low-grade glioma (LGG) and glioblastoma multiforme (GBM)] from UCSD; and subarachnoid haemorrhage (SAH) from the Translational Genomics Research Institute (TGen). Aliquots from each pool of CSF were first used to assess the extracellular vesicles (EVs) in pooled CSF samples for each diagnostic group. The remaining aliquots were distributed across three institutes, where RNA isolation was performed in parallel using commercial RNA isolation kits: two designed to isolate total RNA and two designed to isolate EV RNA. The yield and quality of each RNA sample were assessed using RiboGreen and small RNA Bioanalyzer assays performed at each institute, and the outcomes from the studies were compared. QC, quality control.
![Figure 1. Cerebrospinal fluid (CSF) study design. Pools of CSF were generated for six diagnostic groups (five to 12 subjects/group): neurologically normal subjects (Control) from University of California, San Diego (UCSD); neurodegenerative disease [Alzheimer’s disease (AD) and Parkinson’s disease (PD)] from Oregon Health & Science University (OHSU); central nervous system tumour [low-grade glioma (LGG) and glioblastoma multiforme (GBM)] from UCSD; and subarachnoid haemorrhage (SAH) from the Translational Genomics Research Institute (TGen). Aliquots from each pool of CSF were first used to assess the extracellular vesicles (EVs) in pooled CSF samples for each diagnostic group. The remaining aliquots were distributed across three institutes, where RNA isolation was performed in parallel using commercial RNA isolation kits: two designed to isolate total RNA and two designed to isolate EV RNA. The yield and quality of each RNA sample were assessed using RiboGreen and small RNA Bioanalyzer assays performed at each institute, and the outcomes from the studies were compared. QC, quality control.](/cms/asset/55bf0328-c6da-4f23-8520-ab861db33ac5/zjev_a_1317577_f0001_b.gif)
Figure 2. Determination of size distribution of cerebrospinal fluid (CSF) extracellular vesicles (EVs) in CSF samples. CSF from each diagnostic group was analysed using (a) nanoparticle tracking analysis and (b) vesicle flow cytometry. Histograms represent the average of two measurements normalised to the maximum frequency to illustrate the particle size distribution across the six diagnostic groups. AD, Alzheimer’s disease; PD, Parkinson’s disease; LGG, low-grade glioma; GBM, glioblastoma multiforme; SAH, subarachnoid haemorrhage.

Figure 3. Determination of nanoparticle (NP) and extracellular vesicle (EV) concentrations in cerebrospinal fluid (CSF). Nanoparticle tracking analysis (NTA) and vesicle flow cytometry (VFC) were used to determine nanoparticle and EV concentrations for the CSF samples. By NTA, the nanoparticle concentration for the Control was 4.3 × 10⁶/μL, and the diagnostic groups ranged from 4.8 × 10⁶/μL to 42 × 106/μL (grey bars). By VFC, the EV concentration for the Control was 2.2 × 10⁶/μL, and the diagnostic groups ranged from 2.2 × 10⁶/μL to 14.0 × 10⁶/μL (black bars). AD, Alzheimer’s disease; PD, Parkinson’s disease; LGG, low-grade glioma; GBM, glioblastoma multiforme; SAH, subarachnoid haemorrhage.
Figure 4. Replication of RNA yields across sites, normalised to a shared RNA reference sample. RNA yields from 1.0 mL of cerebrospinal fluid (CSF) from each diagnostic group were assessed by RiboGreen assay. The results show the intralaboratory (n = 2 samples) and interlaboratory (n = 3 sites) replication of RNA yields ((a,b)), normalised to a reference RNA sample ((c)) prepared from plasma at the Translational Genomics Research Institute (TGen), and shared with Oregon Health & Science University (OHSU) and University of California, San Diego (UCSD). The linear scale coefficient of variation across all measurements is listed below each diagnostic group. AD, Alzheimer’s disease; PD, Parkinson’s disease; LGG, low-grade glioma; GBM, glioblastoma multiforme; SAH, subarachnoid haemorrhage; ExRNA, extracellular RNA.
Figure 5. Replication of RNA size and purity across sites. RNA from each isolation kit was profiled by small RNA Bioanalyzer assays. Profiles show the intralaboratory (n = 2 samples) and interlaboratory (n = 3 sites) of RNA purity for each diagnostic group. y-axis = fluorescent units; x-axis = time (s) (circle = ~ 4 nt, triangle = ~ 150 nt). AD, Alzheimer’s disease; PD, Parkinson’s disease; LGG, low-grade glioma; GBM, glioblastoma multiforme; SAH, subarachnoid haemorrhage; ExRNA, extracellular RNA.
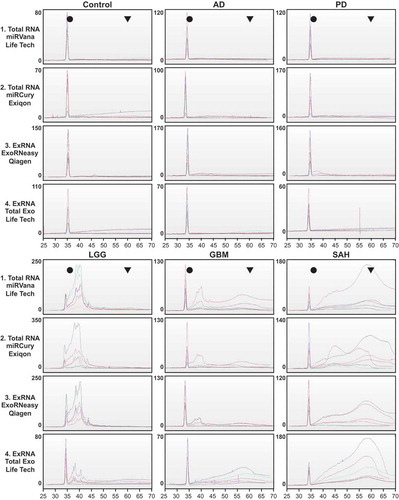
Figure 6. Study design for RNA expression studies. We used total RNA from the mirVana kit and extracellular vesicle (EV) RNA from the exoRNeasy kit for expression analysis. RNA expression was profiled using Qiagen microRNA (miRNA) reverse transcription–quantitative polymerase chain reaction (RT-qPCR) arrays performed at Oregon Health & Science University (OHSU), Qiagen mRNA RT-qPCR arrays performed at University of California, San Diego (UCSD), and small and long RNA sequencing (RNASeq) performed at the Translational Genomics Research Institute (TGen). All RNA present in a 1.0 mL cerebrospinal fluid (CSF) sample was used for the miRNA and messenger RNA (mRNA) RT-qPCR arrays. For the RNASeq assays, two 1.0 mL samples per kit were pooled, then 3.67 ng RNA was used for the small RNASeq and 2.0 ng was used for long RNASeq. See supplemental figures for detailed methods for each expression assay. Dx, diagnostic; AD, Alzheimer’s disease; PD, Parkinson’s disease; LGG, low-grade glioma; GBM, glioblastoma multiforme; SAH, subarachnoid haemorrhage.
Table 1. Cerebrospinal fluid sample collection and processing at each institute.
Table 2. Quantification of total and extracellular vesicle (EV) RNA by the RiboGreen assay.
Figure 7. Distribution of RNA in total vs extracellular vesicle (EV) fraction for each diagnostic group. The bar charts show the distribution of total vs EV RNA detected by (a) microRNA (miRNA) reverse transcription–quantitative polymerase chain reaction (RT-qPCR) array, (b) small RNA sequencing (RNASeq), (c) messenger RNA (mRNA) RT-qPCR array, and (d) long RNASeq. In each bar chart, the black bar indicates the number of RNA detected only in the EV fraction, the grey bar indicates the number of RNA detected in common in the EV and the total fractions, and the white bar indicates the number of RNA detected only in the total fraction of the cerebrospinal fluid (CSF). AD, Alzheimer’s disease; PD, Parkinson’s disease; LGG, low-grade glioma; GBM, glioblastoma multiforme; SAH, subarachnoid haemorrhage.
Figure 8. Distribution of RNA detected in total cerebrospinal fluid (CSF) for each neurological disorder, relative to Controls. The distribution of RNA detected in total CSF by (a) microRNA(miRNA) reverse transcription–quantitative polymerase chain reaction (RT-qPCR) array, (b) small RNA sequencing (RNASeq), (c) messenger RNA (mRNA) RT-qPCR array, and (d) long RNASeq. In each bar chart, the black bar indicates the number of RNA uniquely detected in the extracellular vesicle (EV) fraction of the Control sample [not in the diagnostic (Dx) sample], the white bar indicates the number of RNA unique to the Dx group (not in Control), and the grey bar indicates the number of RNA detected in common in both the Control and Dx group sample. Within a measurement type, the total number of RNA detected in the Control group is constant (black plus grey bars), but the unique and common portions change according to the Dx group. AD, Alzheimer’s disease; PD, Parkinson’s disease; LGG, low-grade glioma; GBM, glioblastoma multiforme; SAH, subarachnoid haemorrhage.
![Figure 8. Distribution of RNA detected in total cerebrospinal fluid (CSF) for each neurological disorder, relative to Controls. The distribution of RNA detected in total CSF by (a) microRNA(miRNA) reverse transcription–quantitative polymerase chain reaction (RT-qPCR) array, (b) small RNA sequencing (RNASeq), (c) messenger RNA (mRNA) RT-qPCR array, and (d) long RNASeq. In each bar chart, the black bar indicates the number of RNA uniquely detected in the extracellular vesicle (EV) fraction of the Control sample [not in the diagnostic (Dx) sample], the white bar indicates the number of RNA unique to the Dx group (not in Control), and the grey bar indicates the number of RNA detected in common in both the Control and Dx group sample. Within a measurement type, the total number of RNA detected in the Control group is constant (black plus grey bars), but the unique and common portions change according to the Dx group. AD, Alzheimer’s disease; PD, Parkinson’s disease; LGG, low-grade glioma; GBM, glioblastoma multiforme; SAH, subarachnoid haemorrhage.](/cms/asset/b8430c97-0674-4a96-820e-9a8469bac646/zjev_a_1317577_f0008_b.gif)
Figure 9. Distribution of RNA detected in the cerebrospinal fluid (CSF) extracellular vesicle (EV) fraction for each neurological disorder, relative to Control. The bar plots show the distribution of RNA detected in the EV fraction by (a) microRNA (miRNA) reverse transcription–quantitative polymerase chain reaction (RT-qPCR) array, (b) small RNA sequencing (RNASeq), (c) messenger RNA (mRNA) RT-qPCR array, and (d) long RNASeq, relative to Control EV RNA. In each bar chart, the black bar indicates the number of RNA uniquely detected in the EV fraction of the Control sample [not in the diagnostic (Dx) sample], the white bar indicates the number of RNA unique to the Dx group (not in Control), and the grey bar indicates the number of RNA detected in common in both the Control and Dx group sample. Within a measurement type, the total number of RNA detected in the Control group is constant (black plus grey bars), but the unique and common portions change according to the Dx group. AD, Alzheimer’s disease; PD, Parkinson’s disease; LGG, low-grade glioma; GBM, glioblastoma multiforme; SAH, subarachnoid haemorrhage.
![Figure 9. Distribution of RNA detected in the cerebrospinal fluid (CSF) extracellular vesicle (EV) fraction for each neurological disorder, relative to Control. The bar plots show the distribution of RNA detected in the EV fraction by (a) microRNA (miRNA) reverse transcription–quantitative polymerase chain reaction (RT-qPCR) array, (b) small RNA sequencing (RNASeq), (c) messenger RNA (mRNA) RT-qPCR array, and (d) long RNASeq, relative to Control EV RNA. In each bar chart, the black bar indicates the number of RNA uniquely detected in the EV fraction of the Control sample [not in the diagnostic (Dx) sample], the white bar indicates the number of RNA unique to the Dx group (not in Control), and the grey bar indicates the number of RNA detected in common in both the Control and Dx group sample. Within a measurement type, the total number of RNA detected in the Control group is constant (black plus grey bars), but the unique and common portions change according to the Dx group. AD, Alzheimer’s disease; PD, Parkinson’s disease; LGG, low-grade glioma; GBM, glioblastoma multiforme; SAH, subarachnoid haemorrhage.](/cms/asset/5b397953-635f-4e39-bda7-5779c4f5e0cf/zjev_a_1317577_f0009_b.gif)