Figures & data
Figure 1. Thin sections showing multivesicular bodies (MVBs) contained in cultured HMC-1 cells and extracellular vesicles in the surrounding growth medium. (A) HMC-1 cell containing MVBs (white boxes) and some extracellular vesicles (EVs) in proximity to it (black boxes). The black arrows point to cell protrusions. The letters next to the boxes refer to the adjacent higher magnification panels in the figure. (B–H) MVBs in higher magnification. White arrows point to vesicles containing one or more smaller vesicles. Arrowheads point to electron-dense structures in secretory granules. (I–L) EVs at higher magnification.
Figure 2. Morphologically diverse exosomes purified from HMC-1. (A) Exosomes visualised after negative staining. At least two different categories of vesicle can be identified in this picture: single vesicles (green arrows) and a long tubule (red arrow). (B) Montage of nine cryo-electron micrographs. Green arrows point to single vesicles, yellow arrow points to a double vesicle, and small black arrows point to fiducial gold markers. The circular shape is the carbon edge of the holey carbon grid. (C) Size distribution of all vesicles included in the analysis (n = 1724). The number in brackets indicates how many vesicles were larger than 500 nm. (D) Percentage of total vesicles that belonged to each morphological category. (E) Size distribution for each vesicle category. The top and bottom boundaries of the boxes represent the 75th and 25th percentiles. The top and bottom whiskers represent the 90th and 10th percentiles. The black line in the boxes represents the median while the white line represents the mean.
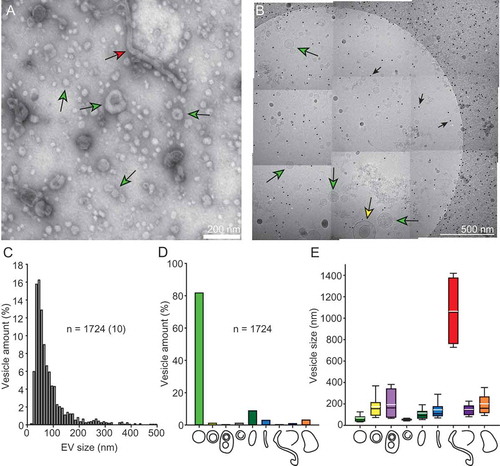
Figure 3. Gallery of exosome categories. (A–G) Three example vesicles for each category are shown, followed by the size distribution of the category. Sample size (n) is indicated and, in brackets, how many vesicles in that category exceeded 500 nm in size.
Figure 4. Gallery of exosome categories. (A, B) Two examples for the category of triple vesicles or more, with drawings to highlight their structure. (C) One example of a filamentous large tubule, with drawing (large tubule in black, nearby vesicles in grey).
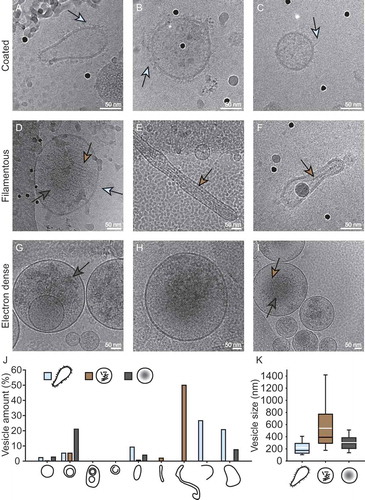
Figure 5. Gallery of exosome features. (A–I) Examples of coated (A–D), filamentous (D–F, I), and electron-dense vesicles (D, G–I). Light blue arrows point to coating, brown arrows point to filaments, and grey arrows point to electron density within vesicles. (J) Percentage of each vesicle category that presented each of the features. (K) Size distribution of vesicles with features.