
Figures & data
Figure 1. NB-derived eqEVs stimulate the expression of pro-tumorigenic cytokines and chemokines in MSCs. MSCs (3 × 10⁴ cells/well) were exposed for 24 h to eqEVs (2.5 µg/well) obtained from SK-N-BE[Citation2] cells. The medium was tested for the presence of 28 cytokines and chemokines using a Luminex bead panel and ELISA (VEGF-A, SDF-1 and TGFβ). The data were generated from triplicate samples in a single experiment. Means and 95% confidence interval of fold changes are shown in box and lines, respectively; red box indicates significant (p < 0.05) fold changes for each comparison versus MSCs. Fold changes are displayed on the left, while the concentrations of cytokines and chemokines in pg/ml are shown on the right-hand side of the figure. The ^ indicates cases in which all observations under one condition group are censored. Similar data were obtained with CHLA-255 and NB-19 cells (Supplemental and ).
![Figure 1. NB-derived eqEVs stimulate the expression of pro-tumorigenic cytokines and chemokines in MSCs. MSCs (3 × 10⁴ cells/well) were exposed for 24 h to eqEVs (2.5 µg/well) obtained from SK-N-BE[Citation2] cells. The medium was tested for the presence of 28 cytokines and chemokines using a Luminex bead panel and ELISA (VEGF-A, SDF-1 and TGFβ). The data were generated from triplicate samples in a single experiment. Means and 95% confidence interval of fold changes are shown in box and lines, respectively; red box indicates significant (p < 0.05) fold changes for each comparison versus MSCs. Fold changes are displayed on the left, while the concentrations of cytokines and chemokines in pg/ml are shown on the right-hand side of the figure. The ^ indicates cases in which all observations under one condition group are censored. Similar data were obtained with CHLA-255 and NB-19 cells (Supplemental Figures 2 and 3).](/cms/asset/a86943bd-d487-4913-b8ca-9bc0851a4302/zjev_a_1332941_f0001_oc.jpg)
Figure 2. Proteomics analysis of three NB-derived eqEV preparations. eqEV preparations from three human NB cell lines, SK-N-BE[Citation2] (BE[Citation2]), CHLA-255 (255) and NB19 were examined by SDS-PAGE and LC-MS/MS as described in Methods. Data were analysed using the FunRich analysis tool [Citation37]. (a) Venn diagram of all proteins identified in each cell line. (b) Enrichment analysis data according to cellular component. (c) Enrichment analysis data according to molecular function. (d) Western blot analysis of eqEVs for the expression of CD63, HMGB1, ALIX and CHGA.
![Figure 2. Proteomics analysis of three NB-derived eqEV preparations. eqEV preparations from three human NB cell lines, SK-N-BE[Citation2] (BE[Citation2]), CHLA-255 (255) and NB19 were examined by SDS-PAGE and LC-MS/MS as described in Methods. Data were analysed using the FunRich analysis tool [Citation37]. (a) Venn diagram of all proteins identified in each cell line. (b) Enrichment analysis data according to cellular component. (c) Enrichment analysis data according to molecular function. (d) Western blot analysis of eqEVs for the expression of CD63, HMGB1, ALIX and CHGA.](/cms/asset/0a54f80b-6e9c-4376-865a-6cfa8ac41a54/zjev_a_1332941_f0002_oc.jpg)
Figure 3. Isolation of NB exosomes by DUC, ODGC and SEC. EVs were collected from the serum-free culture medium of NB cells as indicated in Methods and examined by western blot for the presence of exosomal and non exosomal proteins. (a) Western blot analysis for indicated proteins of duc2kEVs, duc10kEVs and duc100kEVs (1 µg/lane) obtained by DUC of the CM of CHLA-255 (255) and SK-N-BE[Citation2] (BE[Citation2]). (b) Upper: Density and particle number in each fraction obtained by ODGC from the CM of SK-N-BE[Citation2] (BE[Citation2]) cells. Middle: Western Blot analysis of pre (prefractionation) and each fraction analysed by SDS-PAGE (25 µg/lane and 3 µg/lane, respectively). Lower: silver stain of each fraction analysed by SDS-PAGE (10 µl/lane). M, marker. Similar data were obtained with CHLA-255 cells. (c) Upper: Protein concentration and particle number of each fraction obtained by SEC from the CM of SK-N-BE[Citation2] cells. Similar data were obtained with seven other NB cell lines (). Middle and Lower: Western blot analysis and silver stain of each fraction analysed by SDS-PAGE (3 μg/lane and 10 μl/lane, respectively). The data are representative of at least three independent experiments showing similar results. Molecular weight standards are indicated (in kDa) on the side of the gels.
![Figure 3. Isolation of NB exosomes by DUC, ODGC and SEC. EVs were collected from the serum-free culture medium of NB cells as indicated in Methods and examined by western blot for the presence of exosomal and non exosomal proteins. (a) Western blot analysis for indicated proteins of duc2kEVs, duc10kEVs and duc100kEVs (1 µg/lane) obtained by DUC of the CM of CHLA-255 (255) and SK-N-BE[Citation2] (BE[Citation2]). (b) Upper: Density and particle number in each fraction obtained by ODGC from the CM of SK-N-BE[Citation2] (BE[Citation2]) cells. Middle: Western Blot analysis of pre (prefractionation) and each fraction analysed by SDS-PAGE (25 µg/lane and 3 µg/lane, respectively). Lower: silver stain of each fraction analysed by SDS-PAGE (10 µl/lane). M, marker. Similar data were obtained with CHLA-255 cells. (c) Upper: Protein concentration and particle number of each fraction obtained by SEC from the CM of SK-N-BE[Citation2] cells. Similar data were obtained with seven other NB cell lines (Figure 7). Middle and Lower: Western blot analysis and silver stain of each fraction analysed by SDS-PAGE (3 μg/lane and 10 μl/lane, respectively). The data are representative of at least three independent experiments showing similar results. Molecular weight standards are indicated (in kDa) on the side of the gels.](/cms/asset/d0c6be42-919b-4517-925e-40cbed3d0b51/zjev_a_1332941_f0003_oc.jpg)
Figure 4. Analysis of NB-derived exosomes by NTA and TEM. (a) Representative concentration vs. size plot by NTA on NB-derived duc100kEVs, odgcEVs and secEVs. The number represents the mode size. (b) Representative TEM pictures of same preparations as in (a) (CHLA-255 for duc100kEVs and secEVs, SK-N-BE[Citation2] for odgcEVs). (c) The amount of EVs obtained from 500 ml of CM from indicated cell lines by the three purification methods was estimated by NTA. The data represents the mean (±SD) particle number from three determinations on a single sample.
![Figure 4. Analysis of NB-derived exosomes by NTA and TEM. (a) Representative concentration vs. size plot by NTA on NB-derived duc100kEVs, odgcEVs and secEVs. The number represents the mode size. (b) Representative TEM pictures of same preparations as in (a) (CHLA-255 for duc100kEVs and secEVs, SK-N-BE[Citation2] for odgcEVs). (c) The amount of EVs obtained from 500 ml of CM from indicated cell lines by the three purification methods was estimated by NTA. The data represents the mean (±SD) particle number from three determinations on a single sample.](/cms/asset/b05f0a6f-69c0-4da3-867c-2b5f1d1b5bd6/zjev_a_1332941_f0004_oc.jpg)
Figure 5. Uptake of NB-derived exosomes by MSCs. (a) Fluorescence microscopy of MSCs (3 × 10⁴/well) after 24 h of incubation in the presence of PKH67-labelled exosomes from three NB cell lines prepared as indicated in Methods. Bar = 20 µm. (b) Confocal microscopy images of MSCs incubated for 24 h in the presence of liposomes, CHLA-255 exosomes or SK-N-BE[Citation2] exosomes labelled with PKH67. MSCs were stained with the red fluorescent membrane dye FM™4-64FX as described in Methods. (c) Same as (b) with green and red boxes representing z sections. Bar = 50 µm in (a) and (b), and 10 µm in (c). The data are representative of three independent experiments showing similar results.
![Figure 5. Uptake of NB-derived exosomes by MSCs. (a) Fluorescence microscopy of MSCs (3 × 10⁴/well) after 24 h of incubation in the presence of PKH67-labelled exosomes from three NB cell lines prepared as indicated in Methods. Bar = 20 µm. (b) Confocal microscopy images of MSCs incubated for 24 h in the presence of liposomes, CHLA-255 exosomes or SK-N-BE[Citation2] exosomes labelled with PKH67. MSCs were stained with the red fluorescent membrane dye FM™4-64FX as described in Methods. (c) Same as (b) with green and red boxes representing z sections. Bar = 50 µm in (a) and (b), and 10 µm in (c). The data are representative of three independent experiments showing similar results.](/cms/asset/1eedc77d-8a15-434d-b8b5-c1b6d78c6397/zjev_a_1332941_f0005_oc.jpg)
Figure 6. NB-derived exosomes stimulate the production of cytokines and chemokines by MSCs. (a) Western blot (4 µg/lane) analysis of the three preparations used in (b). (b) MSCs (3 × 10⁴/well in 100 µl of serum-free culture medium) were exposed for 24 h to indicated amount of NB-derived duc100kEVs, odgcEVs and secEVs as shown in and . The culture medium was then analysed for the presence of IL-6, IL-8/CXCL8, MCP-1/CCL2, and VEGF by ELISA. The data represent the mean (±SD) values in pg/ml of triplicate samples from one experiment and are representative of two independent experiments showing similar results. The p-values are between untreated (MSCs only) and exosome-treated MSCs. ****p < 0.0001, ***p < 0.001, **p < 0.01 and *p < 0.05.
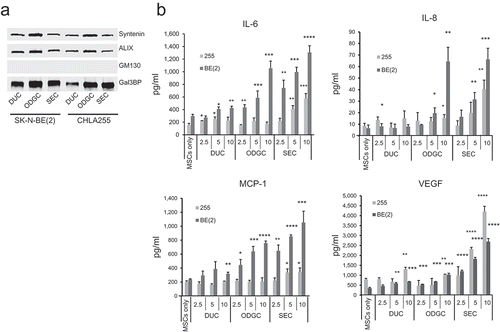
Figure 7. Stimulation of IL-6 and IL-8/CXCL8 in MSCs by exosomes from eight NB-cell lines. (a) Western blot analysis of secEVs (2.5 µg/lane) from indicated cell lines. (b) secEVs were added to cultured MSCs (5.0 µg/3 × 104 cells) and the medium was analysed after 24 h for IL-6 and IL-8/CXCL8 concentrations by ELISA. The data represent the mean (±SD) concentrations from triplicate samples in a single experiment. MYCN status is indicated at the bottom (NA = non-amplified; A = amplified) and the characteristics of the cell lines are shown in Supplemental Table 2. The p-values are between untreated (MSCs only) and exosome-treated MSCs. ****p < 0.0001, ***p < 0.001, **p < 0.01 and *p < 0.05.
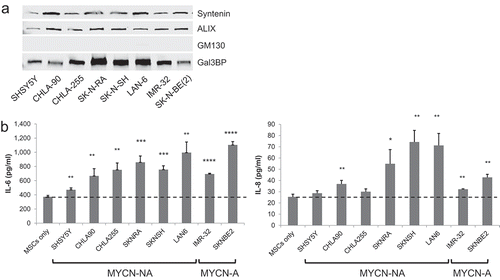
Figure 8. Stimulation of IL-6 and IL-8/CXCL8 production by NB-derived exosomes is ERK-dependent. (a) MSCs were exposed to SK-N-BE[Citation2]-derived secEVs (50 µg/ml) obtained by SEC and cell lysates collected at indicated times were examined by western blot (15 µg/lane) for the presence of STAT3, ERK1/2, AKT, NFκB (p65) and their phosphorylated forms. Actin was used as a loading control. (b) MSCs were pre-treated for 2 h with MK-2206 (MK, 1 µM) or trametinib (Tram, 1 µM) prior to being treated with SK-N-BE[Citation2]-derived secEVs as in (a). Cell lysates were obtained after 15 min and examined by western blot (15 µg/lane) for the expression of AKT and ERK1/2 and their phosphorylated forms. Actin was used as a loading control. (c) MSCs were pre-treated with trametinib or MK-2206 as in (b) before being exposed to SK-N-BE[Citation2]-derived secEVs as in (a) and (b), and the concentration of IL-6 and IL-8/CXCL8 in the culture medium was determined after 24 h by ELISA. The data represent the mean (±SD) concentration of triplicate samples and are representative of two independent experiments showing similar results. ****p < 0.0001, ***p < 0.001, **p < 0.01, *p < 0.1. ns: non-significant.
![Figure 8. Stimulation of IL-6 and IL-8/CXCL8 production by NB-derived exosomes is ERK-dependent. (a) MSCs were exposed to SK-N-BE[Citation2]-derived secEVs (50 µg/ml) obtained by SEC and cell lysates collected at indicated times were examined by western blot (15 µg/lane) for the presence of STAT3, ERK1/2, AKT, NFκB (p65) and their phosphorylated forms. Actin was used as a loading control. (b) MSCs were pre-treated for 2 h with MK-2206 (MK, 1 µM) or trametinib (Tram, 1 µM) prior to being treated with SK-N-BE[Citation2]-derived secEVs as in (a). Cell lysates were obtained after 15 min and examined by western blot (15 µg/lane) for the expression of AKT and ERK1/2 and their phosphorylated forms. Actin was used as a loading control. (c) MSCs were pre-treated with trametinib or MK-2206 as in (b) before being exposed to SK-N-BE[Citation2]-derived secEVs as in (a) and (b), and the concentration of IL-6 and IL-8/CXCL8 in the culture medium was determined after 24 h by ELISA. The data represent the mean (±SD) concentration of triplicate samples and are representative of two independent experiments showing similar results. ****p < 0.0001, ***p < 0.001, **p < 0.01, *p < 0.1. ns: non-significant.](/cms/asset/2c67c1dd-4125-4ee0-b24b-8f0a52680510/zjev_a_1332941_f0008_b.gif)
Figure 9. Inhibition of ERK1/2 does not prevent exosome uptake by MSCs. MSCs were incubated in the absence or presence of trametinib (1 µM) 2 h before the addition of PKH-67-labelled SK-N-BE[Citation2]-derived exosomes (5 × 10⁹ particles/ml) and examined at indicated times for exosome uptake by confocal microscopy as shown in . Scale bar = 50 µm.
![Figure 9. Inhibition of ERK1/2 does not prevent exosome uptake by MSCs. MSCs were incubated in the absence or presence of trametinib (1 µM) 2 h before the addition of PKH-67-labelled SK-N-BE[Citation2]-derived exosomes (5 × 10⁹ particles/ml) and examined at indicated times for exosome uptake by confocal microscopy as shown in Figure 5. Scale bar = 50 µm.](/cms/asset/e46062f7-078f-4cb4-afc2-037e5b5d46e6/zjev_a_1332941_f0009_oc.jpg)