Figures & data
Figure 1. Heat treatment induces a stress response in directly treated cells. MCF7 cells were heat shocked at 45°C (HS) control treated at 37°C (Ctrl) for 1 h and then maintained at 37°C for 24 h. The levels of HSP70 and GAPDH were assayed after heat shock (a) via western blotting (see Supplementary figure 4 for full blots) and the ratio of HSP70 to GAPDH was calculated (b). Error bars represent standard error of the mean for three biological replicates. The levels of DNA damage (c), cell viability (d) and apoptosis (e) in treated cells were measured using the comet assay, the MTT assay and the apoptosis assay, respectively. For comet assays at least 500 cells were counted across two biological replicates. Box and whisker plots show percentage of DNA in the comet tail, median, upper and lower quartiles, error bars are 1.5× interquartile range. For MTTs absorbance at 595 nm in 30 wells containing treated cells was measured. Box and whisker plots show absorbance at 595 nm, median, upper and lower quartiles, error bars are 1.5× interquartile range. For apoptosis assays at least 1000 cells were counted across two biological replicates, error bars represent standard deviation. *p < 0.05, **p < 0.01 and ***p < 0.001.
Figure 2. Heat shock induces DNA damage and apoptosis which can be transferred to bystander cells MCF7 cells were heat shocked at 45°C (HS) or kept at the control temperature of 37°C (Ctrl) for one hour and then maintained at 37°C for 24 h. Conditioned media (CM) was removed from cells and placed onto naïve MCF7 cells. Twenty-four hours later, the level of DNA damage (a) and apoptosis (b) was measured in the bystander cells. For comet assays a total of at least 140 cells were counted across two biological replicates. Box and whisker plots show percentage of DNA in the comet tail, median, upper and lower quartiles, error bars are 1.5× interquartile range. For apoptosis assays at least 1000 cells were counted across two biological replicates, error bars represent standard deviation. *p < 0.05, **p < 0.01 and ***p < 0.001.
Figure 3. EVs mediate heat shock-induced BE (a) Representative TEM images of EVs extracted from heat shocked or control MCF7 cells. (b) Western blot of cellular or EV protein (see Supplementary figure 4 for full membrane images). (c) NanoSight-derived counts for EVs extracted from control and heat shocked MCF7 cells. Error bars show standard error of the mean for three biological replicates. (d) Average EV size measured using TEM. Error bars show standard error of the mean for a total of 50 EVs counted. (e–g) MCF7 cells were heat shocked at 45°C (HS) or maintained at the control temperature of 37°C (Ctrl) for 1 h and maintained at 37°C for 24 h. The conditioned media (CM) was removed, EVs were isolated and placed onto naïve MCF7 cells, 24 h later the level of DNA damage (e), apoptosis (f) and viability (g) of the bystander cells was measured. For comet assays a total of at least 300 cells were counted across two biological replicates. Box and whisker plots show percentage of DNA in the comet tail, median, upper and lower quartiles, error bars are 1.5× interquartile range. For apoptosis assays at least 800 cells were counted across four biological replicates, error bars represent standard error of the mean. For MTTs absorbance at 595 nm in 30 wells containing treated bystander cells was measured. Box and whisker plots show absorbance at 595 nm, median, upper and lower quartiles, error bars are 1.5× interquartile range. *p < 0.05, **p < 0.01 and ***p < 0.001.
Figure 4. Heat shock BE mediates an adaptive response in recipient cells. MCF7 cells were heat shocked after pre-treatment with heat shocked cell EVs (HS EV) or control-cell EVs (Ctrl EV); effects on DNA damage (a) and apoptosis (b) were measured using the comet assay and apoptosis assay, respectively. The data show a protective effect when cells are heat shocked after pre-treatment with heat shocked cell EVs. For comet assays a total of at least 250 cells were counted across two biological replicates. Box and whisker plots show percentage of DNA in the comet tail, median, upper and lower quartiles, error bars are 1.5× interquartile range. For apoptosis assays, at least 800 cells were counted across two biological replicates, error bars represent standard error of the mean. (c) MCF7 cells were incubated for 1 h at 45°C or 37°C whilst being treated with EV uptake inhibitors (amiloride or dynasore) or vehicle (control). Twenty-four hours later, viability was measured using the MTT assay. Readings at 45°C for each group were normalised to the average reading for that group at 37°C and then samples were normalised to the vehicle control. Error bars show standard error of the mean for twelve biological replicates. *p < 0.05, **p < 0.01 and ***p < 0.001.
Figure 5. Heat shock EVs can induce migration in bystander cells. (a) Schematic of the trans-well Matrigel invasion assay. (b) MCF7 cells were treated with either EVs from control cells (Ctrl EVs) or heat shocked cells (HS EVs) and the number of invasive cells in the trans-well Matrigel invasion assay was counted. Results are presented normalised to invasiveness of cells receiving control EVs. Error bars represent standard of the mean of nine biological replicates. Single star indicates p < 0.05. Representative images of the Matrigel assay are shown for cells treated with control (c) or heat shock (d) EVs. *p < 0.05.
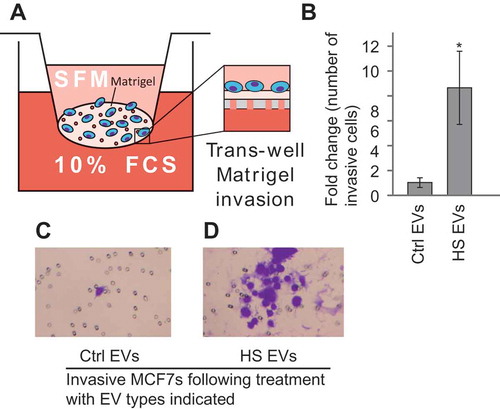
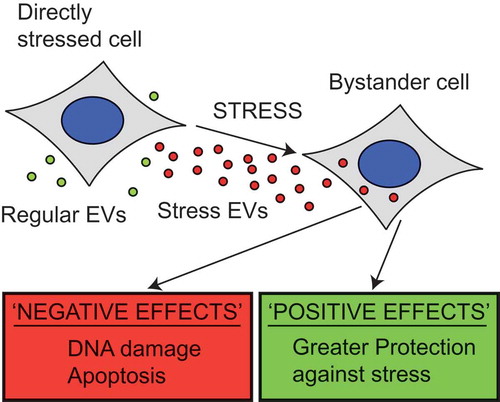
Figure 6. EVs released during stress show both positive and negative effects on the surrounding population. When stressed cells release EVs they have a variety of effects on the nearby cells. Bystander cells show higher levels of DNA damage and apoptosis following treatment with heat shock derived vesicles, whilst the level of cell viability was reduced. These are all negative effects of the bystander effect; however, positive effects have also been demonstrated. Cells treated with HS EVs show greater invasiveness and show greater protection against heat treatment. These results both suggest that the bystander effect is not simply spreading damage but may in fact aid the survival of the bystander cells.