Figures & data
1. Primer sequences for miRs and U6.
Figure 1. Characterization of cardiosphere-derived cell (CDC) extracellular vesicles (EVs). (a) Nanotracking analysis of EVs derived from three donor sources. (b) Electron microscopy (EM) and cryo-EM of CDC-EVs (negative-stain images in left-hand panels). (c) Western blot showing the presence of conserved tetraspanin CD81 and Periostin, and the absence of the endoplasmic reticulum marker Calnexin. (d) Bioactivity of CDC EVs as shown by acetylcholinesterase (AChE) activity. All fluorescence values were background-subtracted (Plasma-Lyte vehicle) and graphed as AChE activity per microgram of EV input. An input amount of 40 pg purified AChE from the kit was used as a positive control for the assay.
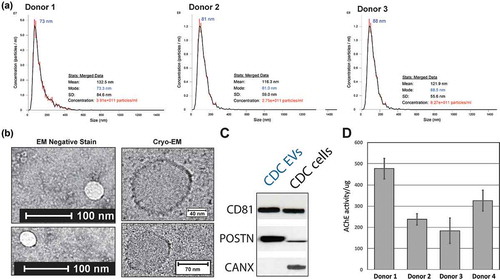
Figure 2. Workflow for the reference gene identification method. Reference genes were identified using small RNA sequencing and a chip-based method. Each data set was unique and included different donors and diverse conditions. Identification of reference genes from each data set was conducted in parallel using the four major algorithms for reference gene identification (NormFinder, GeNorm, BestKeeper and Delta Ct). (a) Common microRNAs (miRs) were selected from each set for further validation using reverse transcription–quantitative polymerase chain reaction (RT-qPCR) in a third unique sample set. (b) Venn diagram showing miRs identified by sequencing compared to those identified by NanoString. Data are representative of the two donors in common between data sets 1 and 2.
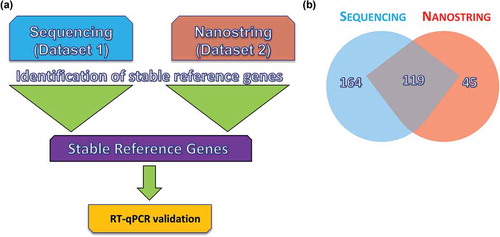
Figure 3. Identification of candidate genes from next-generation small RNA sequencing of nine samples, from six unique cardiosphere-derived cell (CDC) donors and a fibroblast line. All CDC extracellular vesicle (EV) samples were harvested from cells at passage 5, conditioned for 5 days in serum-free media in 20% O2. Two donors also had samples isolated from cells conditioned for 15 days. One donor also had exosomes isolated from cardiospheres conditioned for 5 days. Data were analysed using (a) NormFinder, (b) GeNorm, (c) BestKeeper, and (d) Delta Ct. (e) The weighted geometric mean of each of these samples was taken to provide a consolidated list of the most stable genes. (f) The average of non-normalized hits for each gene was obtained as a measure of abundance.
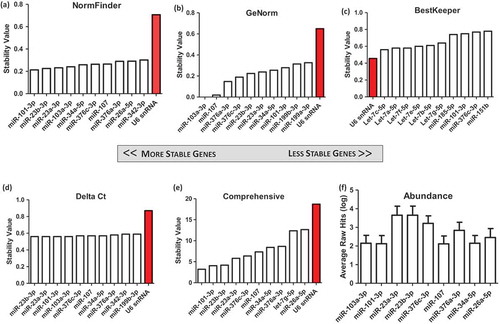
Figure 4. Identification of candidate genes from NanoString absolute microRNA (miR) quantification data of 19 samples, from seven unique cardiosphere-derived cell (CDC) donors and a fibroblast control. All CDC extracellular vesicle (EV) samples were harvested from cells at passage 5, conditioned for 15 days in serum-free media in 5% O2. One donor also had two extra samples of EVs from cells conditioned for 24 h in 2% and 5% O2. Data were analysed using (a) NormFinder, (b) GeNorm, (c) BestKeeper, and (d) Delta Ct. (e) The weighted geometric mean of each of these samples was taken to provide a consolidated list of the most stable genes. (f) The average of non-normalized hits for each gene was obtained as a measure of abundance.
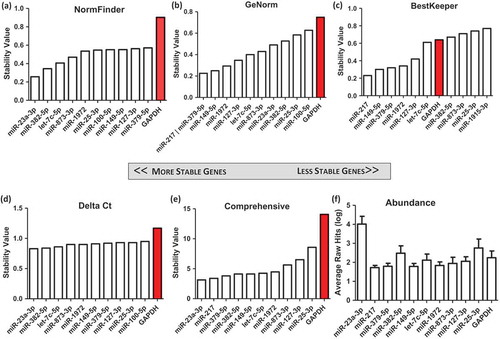
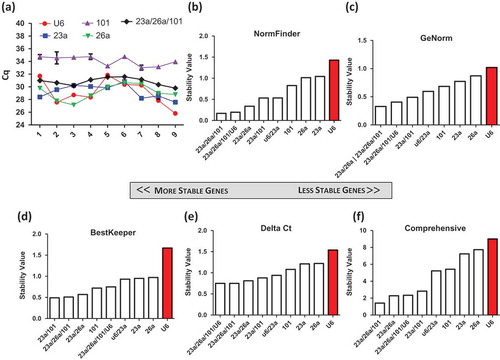
Figure 5. Validation of candidate genes from small RNA sequencing of nine samples, from five unique cardiosphere-derived cell (CDC) donors and a fibroblast line. Four conditions were variable across each sample, including oxygen concentration (2%, 5% and 20%), days of conditioning (5 and 15 days), three different passages (3–5) and a fibroblast control. (a) The Cq values for each sample were plotted to show the fluctuation of expression across donors and conditions.Data were analysed using (b) NormFinder, (c) GeNorm, (d) BestKeeper, and (e) Delta Ct. (f) The weighted geometric mean of each of these samples was taken to provide a consolidated list of the most stable genes.