Figures & data
Figure 1. Characterisation and labelling of extracellular vesicles derived from different prostate cell lines. (a) Representative transmission electron micrographs of more than three independent preparations of EVs isolated from PC-3, LNCaP, PNT2, and RC92a/hTERT cell lines. Scale bars 200 nm. (b) Qualitative Western blot analysis of CD63, CD9, GAPDH, and HSP70 in the 20K microvesicles (MVs), the 110K exosomes (EXOs) and cellular lysates. 25 μg of total protein was loaded per lane. Images are representative of three independent experiments. (c) Representative histograms of the labelling efficacy of EVs using Apogee A50 micro flow cytometer. Unlabelled EVs (Ctrl), SP-DiOC18(3) labelled EVs (DiO EVs), and SP-DiOC18(3) labelled EVs after 0.15% SDS treatment (DiO EVs + SDS) (n = 2). (d) Histograms of the uptake of different concentrations of SP-DiOC18(3) labelled EVs (106–1010 particles ml–1) by PC-3 cells. Graphs represent the geometric mean fluorescence intensity (gMFI) of the cells with the different EV concentrations. Bars represent the mean ± SEM of three independent experiments. (e) Representative histograms of three uptake experiments of DiIC18(5)-DS (DiI) labelled EVs by PC-3 cells after 3 h of incubation at 37°C and 4°C in comparison to the unstained EVs (Ctrl).
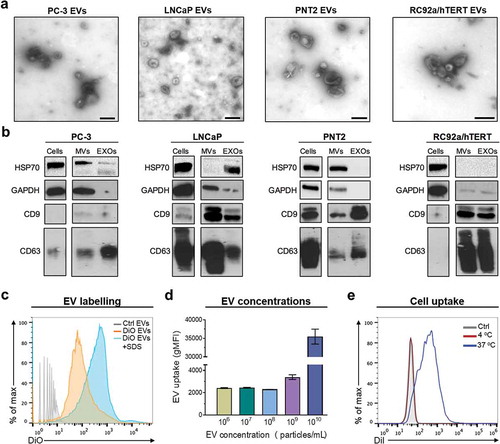
Figure 2. Uptake of prostate cell-derived EVs analysed by flow cytometry and confocal microscopy. Fluorescently labelled EVs (109 particles ml–1) isolated from PC-3, LNCaP, PNT2 and RC92a/hTERT cells were incubated with (a) PC-3 and (b) PNT2 cells. Cells were analysed by flow cytometry and results were plotted as normalised geometric mean fluorescent intensity (gMFI) of EV fluorescence in cells. Bars represent mean ± SEM of three independent experiments. *p < 0.05, **p < 0.01, ***p < 0.001, ****p < 0.0001, two-way ANOVA with Tukey’s multiple comparisons test. (c) Representative confocal images of two different experiments per group depicting DiIC18(5)-DS labelled EVs (pseudo-coloured green) incubated with PNT2 cells (plasma membrane marker CD44 pseudo-coloured red and nuclei blue) for 16 h. Middle images (optical sections), smaller images (vertical sections). (d) Maximum intensity projections created from stack of optical sections. Scale bars, 10 μm.
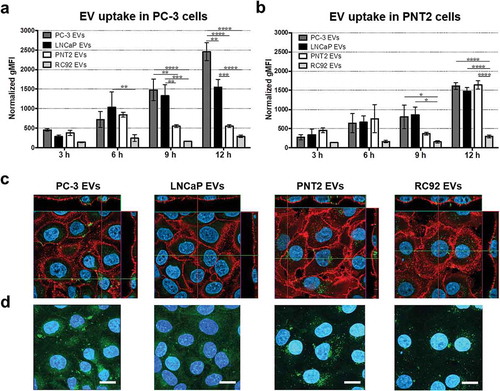
Figure 3. Uptake of prostate cell-derived 20K microvesicles and 110K exosomes analysed by high content microscopy. Fluorescently labelled 20K microvesicles (MVs) and 110K exosomes (EXOs) (109 particles ml–1) from PC-3, LNCaP, RC92a/hTERT, and PNT2 cells were incubated with (a) PC-3 and (b) PNT2 cells for 3, 6, 9, and 12 h. An algorithm that segmented cellular features based on size and fluorescent intensity was used to analyse all images. Parameters were kept constant between different samples. Results represent percentage of cells with EVs normalised by the total number of cells. Dots represent the mean ± SEM of two independent experiments.
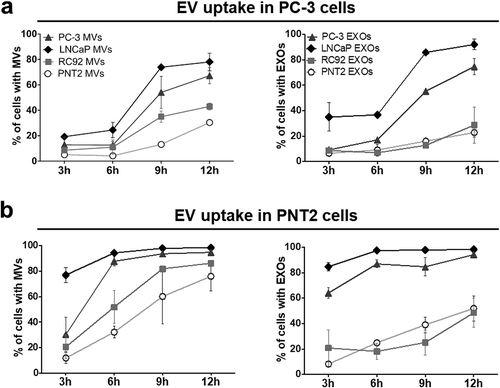
Figure 4. Localisation of the EV-associated DiIC18(5)-DS label in prostate cells. (a) Cells were incubated for 16 h with PC-3 and PNT2 DiIC18(5)-DS labelled EVs (DiIC18-EVs) (pseudo-coloured green). Cells were immunostained with antibodies against CD44 for the localisation of plasma membrane (PM), EEA1 for early endosomes (EE), Lamp1 for lysosomes (LYS), and GM130 for Golgi (red), and imaged by confocal microscopy. Scale bars 10 µm. Insets show a zoom into the organelle. (b) The percentage of the DiIC18 dye co-localisation with each antibody was quantified by Imaris software (n = 42–110 cells). Error bars represent the mean ± SEM of 8–36 image frames each, *p < 0.05 unpaired t-test.
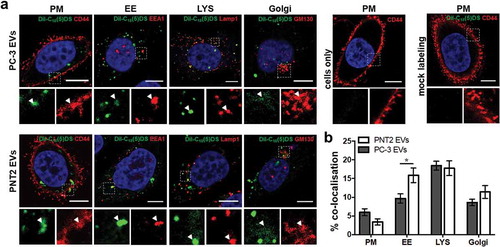
Figure 5. Uptake of prostate cell-derived EVs in the different stages of the cell cycle. PC-3 cells were incubated with SP-DiOC18-labelled LNCaP EVs for (a) 24 h or (b) 48 h, and SP-DiOC18-labelled PC-3 EVs for (c) 24 h or (d) 48 h. After fixation, the cells were stained with propidium iodide, and the SP-DiOC18 fluorescence of cells was analysed by flow cytometry. The geometric mean fluorescence intensity (gMFI) of cells in each cell cycle phase was normalised by the fluorescence of cells in the G0/G1 phase. Bars represent mean ± SEM, n = 6 per time point. *p < 0.05, **p < 0.01, ***p < 0.001, ****p < 0.0001, one-way ANOVA with Tukey’s multiple comparisons test. Comparison of the percentage of cells incubated with and without (control) added EVs at the different phases of cell cycle at (e) 3 and 6 h, (f) 24 and 48 h. Error bars represent mean ± SEM of six independent experiments. *p < 0.05, ***p < 0.001, two-way ANOVA with Tukey’s multiple comparisons test.
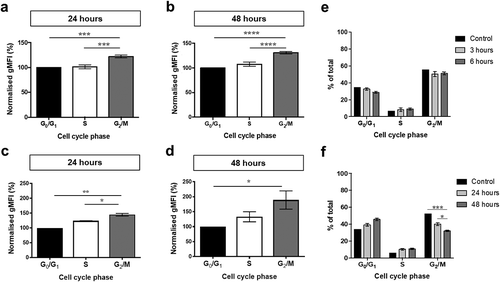
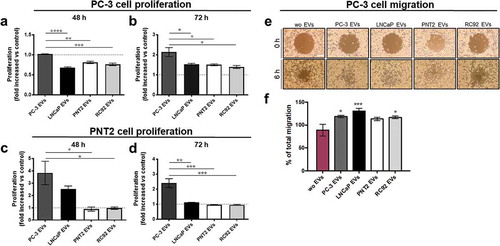
Figure 6. EVs from the metastatic PCa cells induce proliferation and migration in prostate cells. Cells were incubated with 109 EVs derived from PC-3, LNCaP, PNT2 and RC92a/hTERT cells or without (wo) EVs for the indicated times. The proliferation of (a,b) PC-3, and (c,d) the PNT2 cells, was measured using the CFSE-cellular staining by flow cytometry. The results are presented as the proliferation fold change compared to the control without EVs. Bars represent mean ± SEM from three independent experiments. *p < 0.05, **p < 0.01, ***p < 0.001, ****p < 0.0001, one-way ANOVA with Tukey’s multiple comparisons test. (e,f) Migration of PC-3 cells was monitored until gap closure at 6 h in cells incubated with PC-3, LNCaP, RC92a/hTERT, and PNT2-derived EVs or without EVs. Representative images show gap size at 0 and at 6 h (10× magnification, scale bar 200 μm). The percentage (%) of total migration of PC-3 cells after addition of EVs or in untreated control without EVs was calculated. Bars are mean ± SEM from six independent experiments. *p < 0.05, ***p < 0.001, one-way ANOVA with Dunnett’s multiple comparisons test.