Figures & data
Figure 1. GW4869 inhibition of SMPDs differentially affects EV populations (a) Scheme of EV purification from cell culture supernatant (SN) and respective pellets (P) further studied. (b) NTA measured concentrations of P100-EVs and (c) of P14-EVs. Cells were treated for 16 hours with DMSO or 5 µM GW4869 in EV-free DMEM. Each data point is based on samples analyzed in triplicates from mouse L-cells (left chart) and SKBR3 (right chart). (d) SKBR3-EVs in P14 from DMSO or 5 µM GW4869 cells (upper panels) were measured for 30 seconds by flow cytometry. Purified P14-EVs from SKBR3 cells were used to set the SSC and FSC gates. PBS and EV-free DMEM served as controls (lower panels) (e) Quantification of EVs from SN1.5 compared to SN14 and (f) normal, EV-free DMEM and PBS analyzed for 30 seconds by flow cytometry. (g) Quantification from (d) of EVs normalized to DMSO and (h) cell viability of cells from d. Significance level: *** < 0.001, ** <0.01, * < 0.05. All experiments were performed at least in biological triplicates.
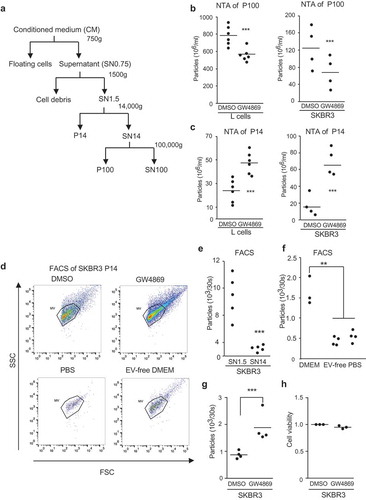
Figure 2. Size distribution and proteins markers of EVs in P14 and P100: Electron microscopy of uranyl-acetate contrast-stained preparations from SKBR3 cells (a) P14 (Scale bar = 250 nm) and (b) P100 (Scale bar = 100 nm). (c) Size distribution of EVs from (a) and (b) in P14 (n = 133) and P100 (n = 180). (d) Size distribution of EVs in P14 and (e) P100 from DMSO and GW4869-treated SKBR3 cells as determined by NTA measurements from three independent experiments. Significance level: *** < 0.001, ** <0.01, * < 0.05. (f) Representative Western Blot of cell extract from SKBR3 cells (CX) and P14 and P100, samples representing equal amounts of proteins were loaded. (n = 3) (g) Heat map of multiplex protein DigiWest analysis of SKBR3 P14 and P100 in biological duplicates. (See Material and Methods).
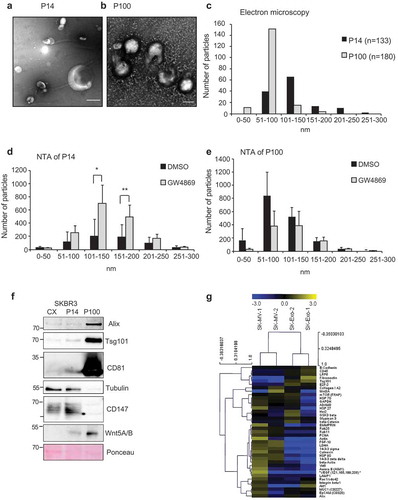
Figure 3. SMPD2 and 3 regulate the release of P14-EVs. Cells treated for 48 hours with siRNA were replated at equal concentrations in EV-free DMEM and EVs purified 24 hours later. Sets of two different siRNAs were used per gene (#1, #2) or combinations thereof for SMPD2&3 (#1, #2, see Material and Methods) (a) Relative concentration of P14-EVs by NTA quantification (n = 3) and (b) representative size distribution of P14-EVs from three biological replicates. (c) Relative concentration of P100-EVs determined by NTA quantification (n = 3) and (d) representative size distribution of P100-EVs from three biological replicates. Significance level: *** < 0.001, ** <0.01, * < 0.05. (e) P14-EVs from SMPD2/3 or control transfected Hek293 cells were measured for 30 seconds by flow cytometry and EVs normalized to control. n = 4 (f) Representative Western Blot of cell extract from SMPD2/3 or control transfected Hek293 cells.

Figure 4. Increase of EV originates from the plasma membrane. (a) Scheme of biotinylation flow cytometry assay. After biotinylation, cells were treated with DMSO, 5 µM GW4869, 80 µM Dynasore for 16 hours before FACS measurement of stained P14-EVs or cells. (b) Representative fluorescence blot of Streptavidin-FITC labeled P14 measured for 30 seconds. (c) Quantification of biotinylated P14-EVs from DMSO, 5 µM GW4869, 80 µM Dynasore treated cells. Unbiotinylated EVs were used as negative controls, as well as Ig-FITC labeled antibodies. n = 4 (d) Flow cytometry: Cell surface staining of CD147-APC, IgG-APC was used as control staining. (e) Quantification of cell surface staining of CD147-APC n = 3 (f) Quantification of P14 surface staining with CD147-APC n = 3 (g) CD81 and Tsg101 immunofluorescence labeling of SKBR3 cells treated with DMSO or GW4869 for 2 hours. (h) Quantification of cell surface staining and (i) P14-EV surface staining with CD81-FITC from DMSO and 5 µM GW4869 treated cells (16h) n = 3. Significance level: *** < 0.001, ** <0.01, * < 0.05.
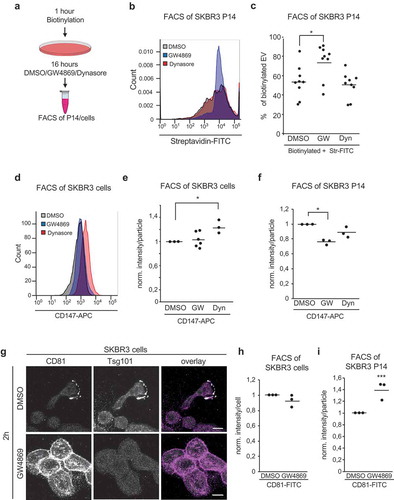
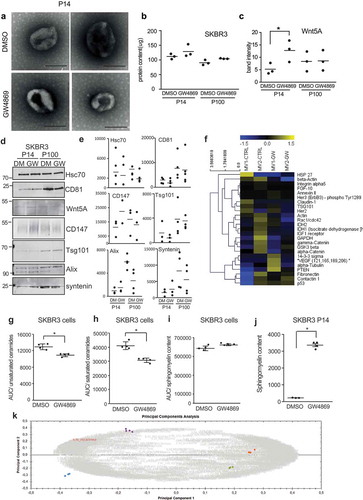
Figure 5. Inhibition of ceramide formation alters cargo and metabolite composition of EV. (a) Electron microscopy of uranyl-acetate contrast-stained P14 preparations from DMSO- or GW4869-treated SKBR3 cells. Scale bar = 250 nm. (b) Total protein concentration of P14 and P100 samples. (n = 3) (c) densitometric quantification of Wnt5A from Supplementary Fig.5d. n = 3 (d) Western Blot analysis of equal amounts of P14 and P100 EV preparations and (e) densitometric quantification of Hsc70, CD81, CD147, Tsg101, Alix and syntenin n > 3. (f) Heat map of multiplex protein DigiWest analysis of SKBR3 P14 from DMSO or GW4869 treated cells in biological duplicates. (g-k) MS analysis of the abundance of ceramides of sphingomyelins in DMSO/GW4869-treated SKBR3 cells and P14-EV: (g) Unsaturated ceramides identified via their specific fragment ion 262.25 m/z, (h) saturated ceramides (fragment ion 264,26 m/z), (i) sphingomyelins (fragment ion 184,07), (j) Standardized normalized abundance of sphingomyelin in DMSO and GW4869 P14-EV (k) Principal component analysis of the whole dataset of metabolites from SKBR3 P14-and P100-EVs showing one representative of three identical experiments. The tightly clustered colored spots represent the four technical replicates of each EV subgroup: blue = P14 DMSO, purple = P14 + GW4869, orange = P100 DMSO, green = P100 + GW4869). Grey numbers indicate the metabolites. The metabolite marked in red as an example corresponds to the sphingomyelin with retention time 9.87 and m/z 765.5473. Significance level: *** < 0.001, ** <0.01, * < 0.05.