Figures & data
Figure 1. Particle and protein concentration in fractions obtained with size-exclusion chromatography (SEC) of rat blood plasma. Protein and particle concentration of 0.5 ml SEC fractions of blood plasma collected from (A) non-fasted or (B) overnight-fasted rats. First, 500 µl plasma precleared of cells, debris and larger vesicles was loaded on a qEV SEC column; 0.5 ml fractions were collected and protein content was measured. Nanoparticle tracking analysis was performed on fractions up to 8.0 ml using an LM10-HS NanoSight instrument. (C) Detail of particle concentrations in early fractions (4.0–5.5 ml) from (A) and (B). (D) Detail of protein concentration in early fractions (4.0–5.5 ml) from (A) and (B).
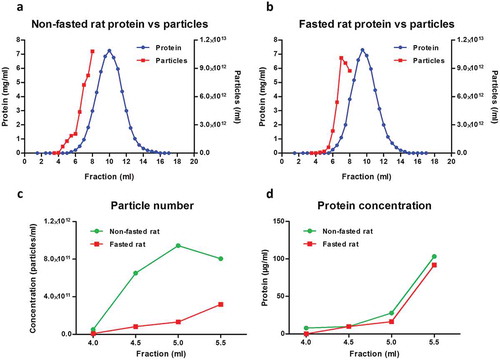
Figure 2. Small extracellular vesicle (sEV) and lipoprotein content in fractions obtained with size-exclusion chromatography (SEC) of rat blood plasma. Protein markers of sEVs (CD9, CD81, HSP70) and lipoproteins [apolipoprotein B (APOB)] were measured using a modified dissociation-enhanced lanthanide fluorescence immunoassay in SEC fractions 3.5–8.0 ml obtained from blood plasma of (A) non-fasted or (B) fasted rats [Citation22]. AU, arbitrary units measured by time-resolved fluorescence. Assays were performed together and AUs from panels (A) and (B) can be compared. (C) Transmission electron microscopy image showing the presence of sEVs (arrows) and lipoproteins (arrowheads) in SEC fraction 5.5 ml collected from plasma of a non-fasted rat. Scale: 200 nm. (D) Triglyceride concentration of early fractions (up to 5.5 ml) collected from plasma of non-fasted and fasted rats.
![Figure 2. Small extracellular vesicle (sEV) and lipoprotein content in fractions obtained with size-exclusion chromatography (SEC) of rat blood plasma. Protein markers of sEVs (CD9, CD81, HSP70) and lipoproteins [apolipoprotein B (APOB)] were measured using a modified dissociation-enhanced lanthanide fluorescence immunoassay in SEC fractions 3.5–8.0 ml obtained from blood plasma of (A) non-fasted or (B) fasted rats [Citation22]. AU, arbitrary units measured by time-resolved fluorescence. Assays were performed together and AUs from panels (A) and (B) can be compared. (C) Transmission electron microscopy image showing the presence of sEVs (arrows) and lipoproteins (arrowheads) in SEC fraction 5.5 ml collected from plasma of a non-fasted rat. Scale: 200 nm. (D) Triglyceride concentration of early fractions (up to 5.5 ml) collected from plasma of non-fasted and fasted rats.](/cms/asset/086c2ad8-f1a5-4ea1-9177-267ef7010b77/zjev_a_1388731_f0002_oc.jpg)
Figure 3. Uptake of lipophilic dye-labelled plasma size-exclusion chromatography (SEC) fractions into mouse cardiac endothelial cells (MCECs). (A) Equal volumes (50 µl) of SEC fractions 3.5–5.5 ml and 8.0 ml obtained from fasted and non-fasted rat blood were labelled with 7.5 µg/ml CellMask Orange lipophilic membrane dye and washed. Small aliquots of the stained material (~15%) were added to a confluent layer of MCECs and incubated for 3 h. The graphs show means with SEM of fluorescence intensity of five images obtained in a single experiment. NR, non-fasted rat; FR, fasted rat; followed by the respective SEC fraction in millilitres; Dye-only, phosphate-buffered saline negative control stained with the lipophilic dye; non-stained, background MCEC fluorescence without addition of a sample; AU, arbitrary fluorescence intensity units. (B) Representative images of fluorescence uptake of SEC fractions from plasma collected from a non-fasted rat. Scale: 50 µm.
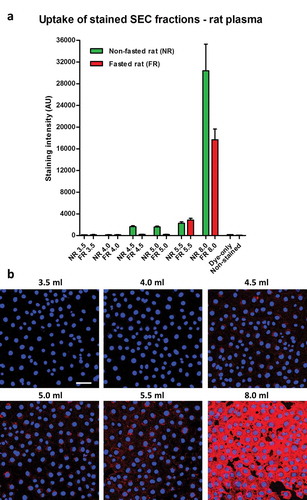
Figure 4. Uptake of lipophilic dye-labelled conditioned medium size-exclusion chromatography (SEC) fractions into mouse cardiac endothelial cells (MCECs). (A) Protein and particle amount (upper panel) and protein and CD81 amount (lower panel) of 0.5 ml SEC fractions collected from serum-supplemented or serum-free amniotic fluid stem cell (AFSC)-conditioned medium. Conditioned medium was precleared of cells, debris and larger vesicles and concentrated to < 500 µl before loading on a qEV SEC column; 0.5 ml fractions were collected and protein content was measured. Nanoparticle tracking analysis was performed on fractions up to 10.5 ml using an LM10-HS NanoSight instrument. CD81 protein marker was measured using a modified dissociation-enhanced lanthanide fluorescence immunoassay in SEC fractions 3.0–10.5 ml [Citation22]. AU, arbitrary units measured by time-resolved fluorescence. Assays were performed together and AUs from serum-free and serum-supplemented samples can be compared. (B) Equal volumes (50 µl) of the indicated SEC fractions were labelled with 7.5 µg/ml CellMask Orange lipophilic membrane dye and washed. Small aliquots of the stained material (~15%) were added to a confluent layer of MCECs and incubated for 3 h. The graphs show means with SEM of fluorescence intensity of five images obtained in a single experiment. SF, serum-free conditioned medium; FBS, serum-supplemented conditioned medium (exosome-depleted foetal bovine serum). (C) Representative images of fluorescence uptake of SEC fractions (indicated) from serum-supplemented conditioned medium. Scale: 50 µm.
![Figure 4. Uptake of lipophilic dye-labelled conditioned medium size-exclusion chromatography (SEC) fractions into mouse cardiac endothelial cells (MCECs). (A) Protein and particle amount (upper panel) and protein and CD81 amount (lower panel) of 0.5 ml SEC fractions collected from serum-supplemented or serum-free amniotic fluid stem cell (AFSC)-conditioned medium. Conditioned medium was precleared of cells, debris and larger vesicles and concentrated to < 500 µl before loading on a qEV SEC column; 0.5 ml fractions were collected and protein content was measured. Nanoparticle tracking analysis was performed on fractions up to 10.5 ml using an LM10-HS NanoSight instrument. CD81 protein marker was measured using a modified dissociation-enhanced lanthanide fluorescence immunoassay in SEC fractions 3.0–10.5 ml [Citation22]. AU, arbitrary units measured by time-resolved fluorescence. Assays were performed together and AUs from serum-free and serum-supplemented samples can be compared. (B) Equal volumes (50 µl) of the indicated SEC fractions were labelled with 7.5 µg/ml CellMask Orange lipophilic membrane dye and washed. Small aliquots of the stained material (~15%) were added to a confluent layer of MCECs and incubated for 3 h. The graphs show means with SEM of fluorescence intensity of five images obtained in a single experiment. SF, serum-free conditioned medium; FBS, serum-supplemented conditioned medium (exosome-depleted foetal bovine serum). (C) Representative images of fluorescence uptake of SEC fractions (indicated) from serum-supplemented conditioned medium. Scale: 50 µm.](/cms/asset/73eafcfc-c945-4c55-a49c-c5b2308607b6/zjev_a_1388731_f0004_oc.jpg)
Figure 5. Uptake of lipophilic dye-labelled size-exclusion chromatography (SEC) fraction aliquots in primary adult rat cardiomyocytes. (A) Equal volumes (50 µl) of SEC fractions 3.5–5.5 ml and 8.0 ml obtained from fasted and non-fasted rat blood were labelled with 7.5 µg/ml CellMask Orange lipophilic membrane dye and washed. Small aliquots of the stained material (~15%) were added to primary rat cardiomyocytes and incubated for 3 h. The graphs show means with SEM of fluorescence intensity of five images obtained in a single experiment. NR, non-fasted rat; FR, fasted rat; followed by the respective SEC fraction in millilitres; Dye-only, phosphate-buffered saline negative control stained with the lipophilic dye; Non-stained, background cardiomyocyte fluorescence without addition of a sample; AU, arbitrary fluorescence intensity units. (B) Representative images of fluorescence uptake of SEC fractions from plasma collected from a non-fasted rat. Scale: 50 µm.
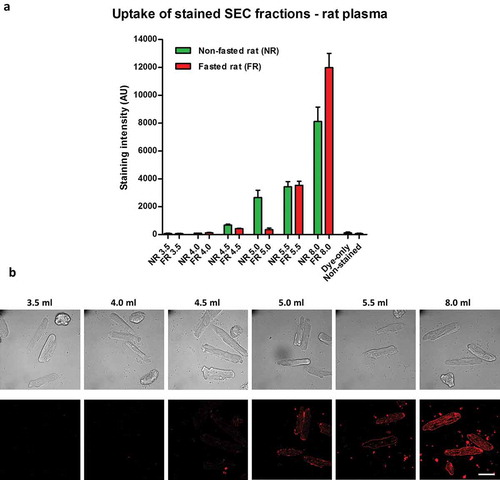
Figure 6. Uptake of lipophilic dye-labelled serum and protein-only samples in mouse cardiac endothelial cells (MCECs). (A) Particle size distribution of complete foetal bovine serum (FBS), in-house prepared exosome-depleted FBS by overnight ultracentrifugation (FBS + O/N UC) and commercially available exosome-depleted FBS (Exo-free FBS) measured by nanoparticle tracking analysis on an LM10-HS NanoSight instrument. (B) Equal volumes (20 µl) of each serum or a pure protein sample [bovine serum albumin (BSA); protein concentration equal to the complete FBS] were labelled with 7.5 µg/ml CellMask Orange lipophilic membrane dye and washed. Small aliquots of the stained material (~15%) were added to MCECs and incubated for 3 h. The graphs show means with SEM of fluorescence intensity of five images obtained in a single experiment. AU, arbitrary fluorescence intensity units; Non-stained, background MCEC fluorescence without addition of a sample. (C) Representative images of fluorescence uptake with sera and BSA samples. Scale: 50 µm.
![Figure 6. Uptake of lipophilic dye-labelled serum and protein-only samples in mouse cardiac endothelial cells (MCECs). (A) Particle size distribution of complete foetal bovine serum (FBS), in-house prepared exosome-depleted FBS by overnight ultracentrifugation (FBS + O/N UC) and commercially available exosome-depleted FBS (Exo-free FBS) measured by nanoparticle tracking analysis on an LM10-HS NanoSight instrument. (B) Equal volumes (20 µl) of each serum or a pure protein sample [bovine serum albumin (BSA); protein concentration equal to the complete FBS] were labelled with 7.5 µg/ml CellMask Orange lipophilic membrane dye and washed. Small aliquots of the stained material (~15%) were added to MCECs and incubated for 3 h. The graphs show means with SEM of fluorescence intensity of five images obtained in a single experiment. AU, arbitrary fluorescence intensity units; Non-stained, background MCEC fluorescence without addition of a sample. (C) Representative images of fluorescence uptake with sera and BSA samples. Scale: 50 µm.](/cms/asset/9381da5c-69c8-4c29-996f-30dbe79d9806/zjev_a_1388731_f0006_oc.jpg)
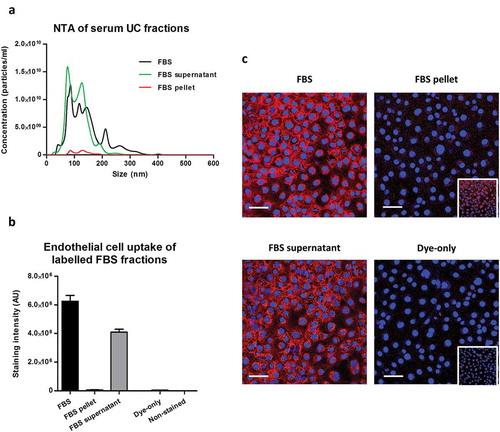
Figure 7. Uptake of lipophilic dye-labelled serum fractions in mouse cardiac endothelial cells (MCECs). (A) Particle size distribution of complete foetal bovine serum (FBS) as well as FBS supernatant and FBS pellet obtained after ultracentrifugation measured by nanoparticle tracking analysis on an LM10-HS NanoSight instrument. (B) Equal starting amounts of each fraction were labelled with 7.5 µg/ml CellMask Orange lipophilic membrane dye and washed. Small aliquots of the stained material (~15%) were added to MCECs and incubated for 3 h. The graphs show means with SEM of fluorescence intensity of five images obtained in a single experiment. AU, arbitrary fluorescence intensity units; Dye-only, phosphate-buffered saline negative control stained with the lipophilic dye; Non-stained, background MCEC fluorescence without addition of a sample. (C) Representative images of fluorescence uptake with serum fractions and Dye-only samples. Scale: 50 µm. Inserts at the bottom of FBS pellet and Dye-only samples are with equally increased contrast and intend to show the higher fluorescence with the FBS pellet.