Figures & data
Figure 1. EV capture, protein extraction and identification workflow.
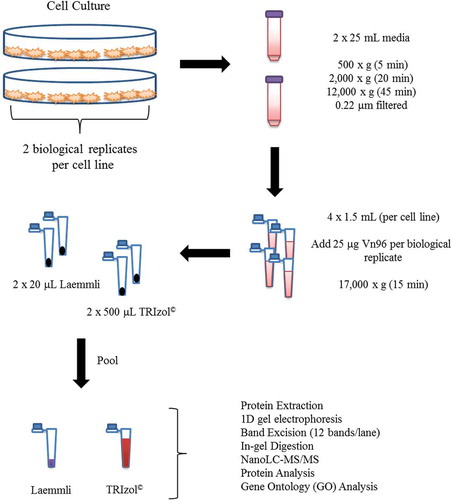
Figure 2. Verification of EV isolation. Laemmli and TRIzol©-extracted samples were interrogated by Western blot for the expression of the canonical EV markers HSP-70, CD63, Flotillin-1, CD81 and CD9. MCF-7 (7), MCF-10A (10A) and MDA-MB-231 (231) cell EVs were examined. HSP-70 (top), CD63 (middle) and Flotillin-1 (bottom) were detected in the isolated EVs.
Figure 3. Comparison of the Laemmli and TRIzol© protein-extraction methods for the extraction of protein cargo from (A) MCF-10A, (B) MCF-7 and (C) MDA-MB-231 EVs. The unique proteins (number and percentage) from Laemmli are shown in blue, while TRIzol©-extracted proteins are shown in red. The common proteome is shown in the central region of the Venn diagram. Percentages below these numbers indicate the percentage of total proteins identified in each region. The upper percentages in bold show the fraction of proteins isolated from each methodology.
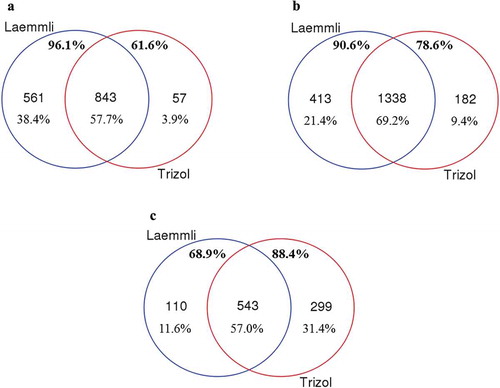
Table 1. List of top 25 proteins from the Exocarta web site that were identified in EVs captured from cell-culture-conditioned media of MCF-10A, MCF-7 and MDA-MB-231 cells.
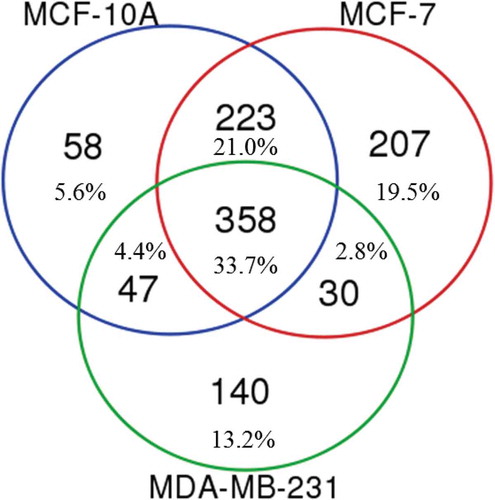
Figure 4. Proteomic analysis of MCF-10A, MCF-7 and MDA-MB-231 EVs revealing sets of common, overlapping and unique proteins from different EV groups. Proteins included in the analysis of each cell type EVs were present using both Laemmli and TRIzol© extraction reagents in both biological replicates.
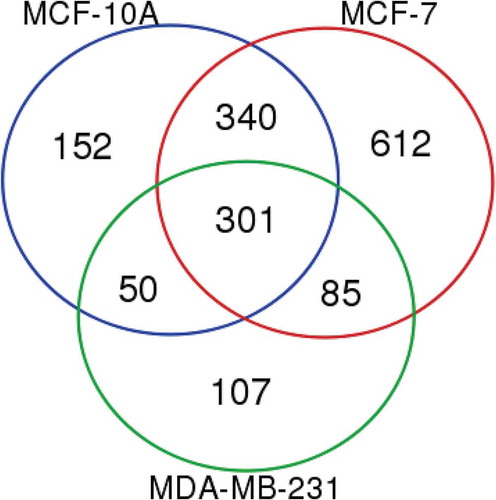
Figure 5. Principal component analysis (PCA) of Laemmli and TRIzol©-extracted EV proteins from MCF-10A, MCF-7 and MDA-MB-231 cells. The two Laemmli (L) and TRIzol© (T) biological replicates selected from each cell line that were used for all analyses were compared. The total list of extracted proteins within each biological replicate of the extraction method was compiled from the technical replicates.
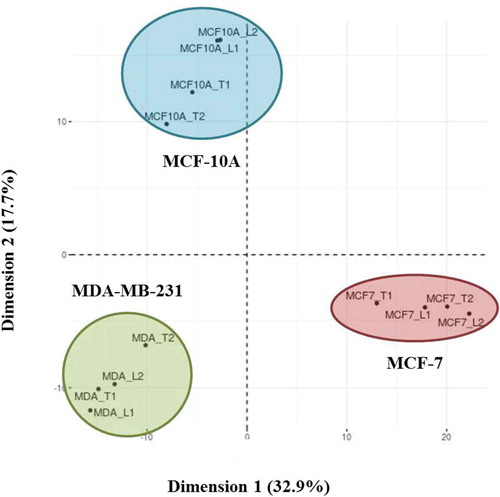
Figure 6. Unique and overlapping gene ontologies (GOs) from MCF-10A, MCF-7 and MDA-MB-231 EVs. The GO terms were identified using ToppFun from the lists of proteins identified using both Laemmli and TRIzol© extracted EV proteins.