Figures & data
Figure 1. GBM cells can exchange functional RNA via EVs. (a) EM image of GBM8 EVs isolated by differential centrifugation (scale bar: 100 nm). (b) Western blot analysis of EV markers CD63, Alix and CD9 on EVs isolated from GBM8 cells. Control: Supernatant from the 70,000 x g centrifugation step. (c) GBM8 cells incubated overnight with PKH67-labelled GBM8 EVs. Arrows indicate PKH67+ cells which have taken up EVs (scale bar: 10 µm). (d) GBM8 cells incubated with 100 ng/µL of isolated EVs show enlarged neurospheres (right picture) as compared with cells incubated with control supernatant from the last centrifugation step (left picture) (scale bars: 100 µm). (e) Luciferase assay on GBM8-FM cells incubated with increasing concentrations of isolated EVs indicates dose-dependent increase in cell number. The graphs show the means ± standard deviation (SD) of three independent experiments. ***indicates p-value ≤0.001 and **** indicates p-value ≤0.0001 as determined by one-way analysis of variance (ANOVA). (f) BrdU incorporation assay reveals increased proliferation rate in cells incubated with 100 ng/µL as compared to control-incubated cells. The graph shows the mean ± standard deviation (SD) of two independent experiments. * indicates p-value ≤0.05 (t-test) (g) Western blot analysis of phospho-ERK on cells incubated as in (f), β-actin was used as a loading control. Numbers above blot represent relative phospho-ERK band intensities. (h) GBM8 spheres were treated with TMZ for 96 h in the presence or absence of 100 ng/µL of GBM8-isolated EVs, and relative cell numbers were estimated by calculating sphere volume. The data are normalised to control-treated cells (100%), and graphs show the means ± SD of four independent experiments. ** indicates p-value ≤0.01, *** indicates p-value ≤0.001 and **** indicates p-value ≤0.0001 as determined by ANOVA.
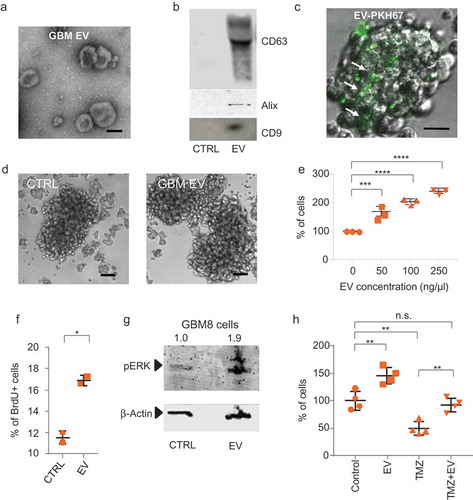
Figure 2. CCR8 acts as an EV receptor (a) GPCR siRNA screening result on HEK-293T cells. Normalised PKH67 fluorescence is displayed on the Y-axis, and each dot represents a siRNA against an individual GPCR Top-8 EV uptake-reducing siRNAs are highlighted in orange and indicated at the right side. (b) siRNA screening validation on GBM8 cells with an independent set of siRNAs. Normalised PKH67 fluorescence (EV uptake) is displayed on the Y-axis. Treatment of cells with Dynasore served as a control for EV uptake reduction. (c) CCR8 inhibitor MC148 reduces EV uptake in a dose-dependent fashion. (d) FACS analysis of CCR8 expression in GBM8 cells. Negative control: No anti-CCR8 primary antibody (e) PKH67 fluorescence (representative of EV uptake) of CCR8− (green) compared to CCR8+ (orange) GBM8 cells. Negative control (grey): GBM8 cells not incubated with PKH67 EVs.
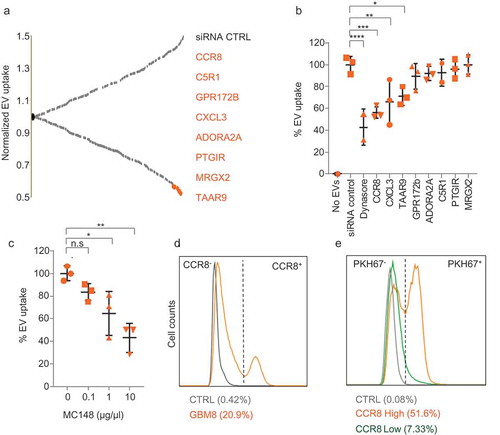
Figure 3. CCR8 inhibition neutralises EV-induced phenotypes in vitro. (a) PKH67 uptake analysis of cells treated with vehicle (green) or with R243 (orange). Control: No PKH67 EVs (grey). (b) Representative pictures of cells incubated as in (a) (scale bars: 25 µm). (c) Relative cell number of cells incubated with and without GBM8 EVs in the presence or absence of R243. Values are normalised to control (vehicle, no EVs), and graphs show the means ± SD of six independent experiments. (d) CellTiter-Glo viability assay (Promega) on GBM8 cells treated with variable concentrations of TMZ and R243. Darker orange represents less viability. (e) Relative cell number of GBM8 spheres incubated with or without 100 ng/µL of GBM8 EVs and treated with TMZ in combination with R243 (orange bars) or vehicle (grey bars). Bars show the means ± SD of four independent experiments. For all experiments * indicates p-value ≤0.05, ** indicates p-value ≤0.01, *** indicates p-value ≤0.001 and **** indicates p-value ≤0.0001 as determined by ANOVA.
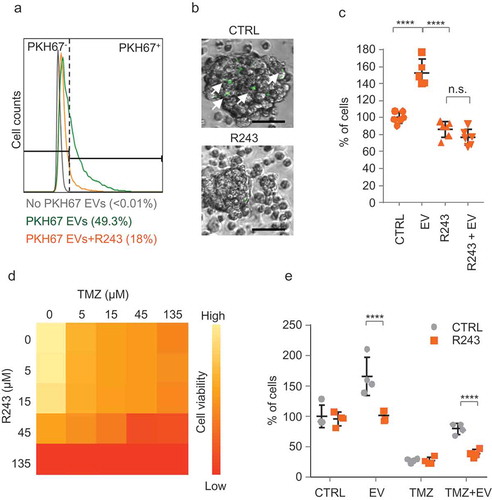
Figure 4. CCR8 and CCL18 expression levels are increased in GBM and are indicators of poor prognosis. (a) Representative pictures of a GBM TMA immunostained against CCR8 (scale bar: 200 µm). (b) Scoring of CCR8 immunoreactivity on TMA of GBM of different grades and healthy tissue. * indicates p-value ≤0.05 (t-test). (c,d) CCR8 and CCL18 mRNA expression analysis on datasets using R2 Analysis and Visualisation Platform. X-axis shows the dataset used. (e,f) Survival analysis of patients expressing high and low levels of CCR8 and CCL18 mRNA, respectively. For expression and Kaplan–Meier analyses R2 online platform (R2.amc.nl) was used. Differential expression was tested by t-test and significance of Kaplan analysis by Mann–Whitney test. p-values for CCR8 expression were 10–10 (Sun/Bechtold), 9–9 (Hegi/Harris) and ˃0.05 for the French dataset. p-values for CCL18 expression were 0.004 (Sun/Bechtold), 0.05 (Hegi/Harris) and 0.0003 for the French dataset.
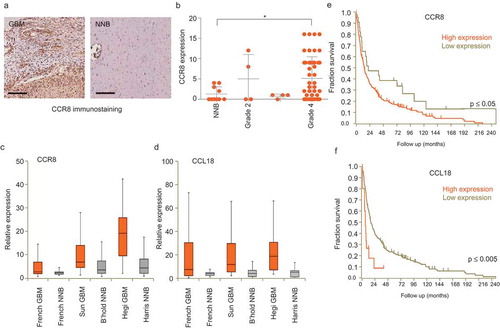
Figure 5. CCL18 enhances EV uptake. (a) EV uptake analysis on GBM8 cells incubated with recombinant CCL18 prior PKH67-EV addition. (b) EV uptake analysis on EVs pre-incubated with CCL18 neutralising antibody. * indicates p-value ≤0.05, ** indicates p-value ≤0.01, *** indicates p-value ≤0.001 as determined by ANOVA. (c,d) ELISA results on plates coated with dilutions of isolated EVs and incubated with anti-CD63 (c) or anti-CCL18 (d). Both incubations displayed dose-dependent signal. (e) Immunogold EM pictures showing GBM EVs with strong reactivity against endogenous CCL18. (f) Positive control: Immunogold staining against the exosomal marker CD63. Ab control: No primary antibody (Scale bars: 25 nm).
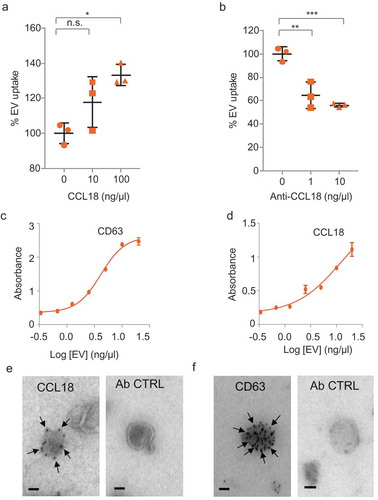
Figure 6. CCL18 acts as a bridging molecule between GAGs on EVs and cellular CCR8 (a–c) Heparan sulphate (a), dermatan sulphate (b) and chondroitin sulphate (c) GAGs are present on EV membranes, as determined by ELISA. (d) EV uptake is prevented by heparin (25 µg/mL) and by (e) Heparinase III (H’se III) (2 miU every 2 h for 6 h at 37°C) treatment of EV isolates. *** indicates p-value ≤0.001 as determined by t-test. (f) Proposed model: GAGs present on the EV membrane bind CCL18 which connects with cellular CCR8 promoting EV uptake. Error bars represent SD of three independent experiments.
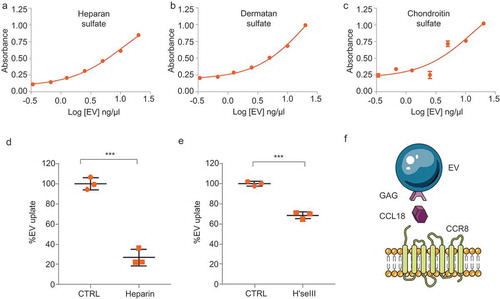
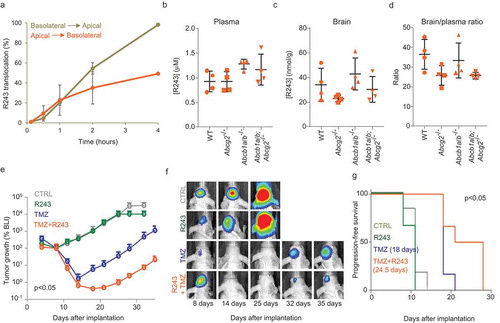
Figure 7. Pharmacological inhibition of CCR8 delays tumour growth after TMZ treatment. (a) R243 transwell translocation assay for the drug transporter P-gp using MDCK cells. Percentage of R243 translocation from basolateral to apical (grey line) and from apical to basolateral (orange line) is plotted on the Y-axis. (b–d) R243 levels were measured in plasma (b) and in brain (c) 1 h after i.v. injection of the drug, and brain-to-plasma ratio was calculated (d). No statistical differences were measured by ANOVA. (e–g) BLI tumour growth analysis of GBM8 mouse xenografts treated with vehicle (grey); R243, 1.0 mg/kg (green); TMZ, 10 mg/kg (blue) or R243 and TMZ combined (orange). Mice were treated with R243 once daily from day 4 to day 8 after tumour injection and TMZ was administered a single time at day 5. The y-axis represents the median BLI normalised to day 8. The p-value was determined by t-test on the area under the curve for TMZ vs TMZ+R243. Representative BLI images are shown in (f) and progression-free survival is calculated in (g). P-value on median progression-free survival was determined by the Log-rank (Mantel-Cox) test.