Figures & data
Figure 1. The effects of A1 conditioned media on mammalian cardiomyocyte proliferation and apoptosis. (a) Representative images of newt-derived A1 cells in culture. Images showing phase contrast (top panel), fluorescent images using an established A1 marker 22/18 alone (second panel), or a fluorescent channel overlay of the 22/18 marker (red), FITC-phalloidin (green) and DAPI (blue) (third panel). To rule out auto-fluorescence, the overlay was regenerated without the 22/18 primary antibody, but including the TRITC-conjugated secondary antibody (red), FITC-phalloidin (green) and DAPI (blue), lower panel. (b) Representative flow cytometry point plots and histograms indicating the abundance of BrdU-positive NRVMs following 48 h priming with 100, 250, 500 µg of A1-CM, or NRVMs without A1-CM priming. Antibodies against α-actinin were used to identify cardiomyocytes. (c) Graphical representation of BrdU incorporation of NRVMs following A1-CM treatments. (d) Representative flow cytometry point plots and histograms detecting annexin V on the surface of NRVMs after 12 h of 100 µg of A1-CM or media control treatments, followed by a 1-hour exposure to 50 µM H2O2 in NRVM media. (e) Graphical representation of the percentage of NRVMs that stain positive for strong annexin V signal for the two treatment groups, following H2O2 application. Experiments were done in triplicate. Standard error bars are displayed. * indicates statistical significance, p < 0.05. Scale bar = 100 µm.
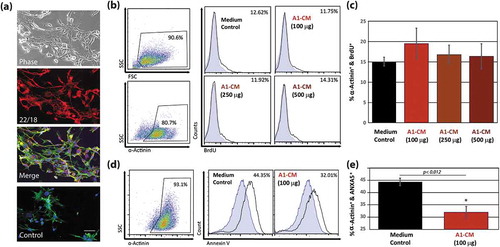
Figure 2. Inhibition of EV secretion following treatment of A1 cells with the ceramide pathway inhibitor, GW4869 and analysis of the anti-apoptotic effects of A1-EVs following oxidative stress. (a) Histogram representations of EV detection in A1-CM following treatment with increasing concentrations of GW4869, as determined by dynamic light scattering methods (NanoSight). Particle size and yield for three treatment groups (DMSO control, 40 and 100 µM GW4869) are also shown. (b) Analysis in bar graph form of particle number per mL (left y-axis) and % particles relative to DMSO control (right y-axis) are displayed for each GW4869 treatment condition on A1 cells. (c) NRVMs exposed to A1-CM or A1-CM (40 µM GW4869) and subjected to oxidative stress (50 µM H2O2, 1 h). Representative images of the fixed and stained cells are shown for each of the four conditions; α-actinin shown in red and annexin V in green. (d) Representative flow cytometry point plots are shown for each of the four conditions. (e) Graphical analysis of the flow cytometry data indicates the percentage of α-actinin+ annexin V+ cardiomyocytes for each of the four conditions. Experiments were done in triplicate. Standard error bars are displayed. * indicates statistical significance, p < 0.05. Scale bar = 100 µm.
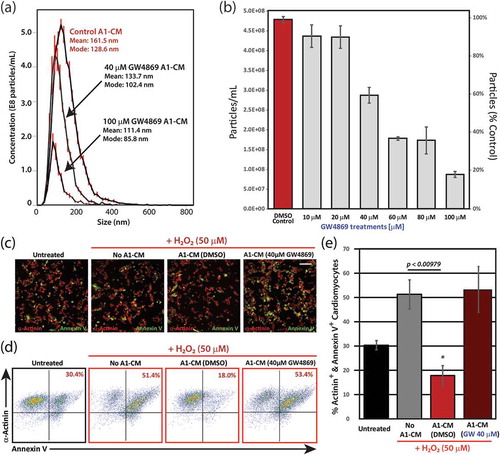
Figure 3. Signalling pathways and gene expression in NRVMs following priming with A1-CM. (a) RNA isolated from NRVMs, following a 12-h treatment with A1-CM, was subjected to deep sequencing and gene pathway analysis using Ingenuity Pathway Analysis. The graph depicts the top canonical pathways involved in cardiomyocyte proliferation and survival. The bar direction, colour and height for the z-score axis indicate the significance of pathway modulation not due to chance (red = increased fold change; blue = decreased fold change). (b) Bar graph depicts the PI3K/AKT pathway z-score changes at 6, 12 and 24 h post A1-CM treatment. (c) Summary table lists each of the individual members of signalling pathway values including z-score, p-value and the ratio of canonical genes modulated within the respective pathway. (d) Individual gene expression of the PI3K/AKT signalling pathway (blue text) and BAD phosphorylation and anti-apoptotic signalling pathways (orange text) within NRVMs following A1-CM or A1-CM (40 µM GW4869) exposures are shown. Expression levels are displayed relative to NRVM controls exposed only to conventional NRVM media.
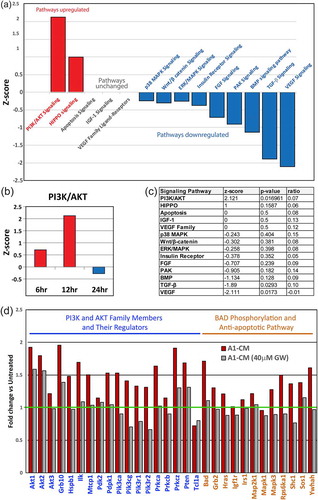
Figure 4. Protein analyses of AKT signalling. (a) Representative Western blot images for protein phospholylation (p-) states and total AKT expression levels across time points including 15-min, 1-, 6- or 12-h post-treatment are shown for untreated, A1-CM, A1-CM (GW4869) and insulin-treated (1 µM) NRVMs. (b) Graphical representations of the quantitation for p-AKT (S473) to total AKT ratio (top graph) and total AKT levels (lower graph). Experiments were performed in triplicate, total AKT band intensities were calibrated to β- actin as the loading control and expression values normalized to untreated controls. Statistical significance differences between untreated NRVMs and treatment groups are indicated by * (p < 0.01), and # indicates statistically significant changes between A1-CM and A1-CM (GW) treatments (p < 0.01).
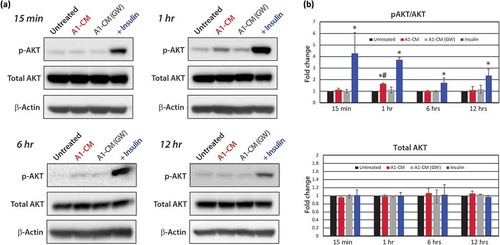
Figure 5. Newt A1-EV characterization. (a) Dynamic light scattering was used to measure A1-EV size and concentration. The red error bars of the histogram indicate +/− one standard error of the mean size. Examples are shown of different A1-EV sizes by negative stain in electron micrographs (insets). (b) Acetylcholineesterase activity was measured for cell culture media (control) or isolated normal human dermal fibroblast (NHDF) EVs, cardiosphere-derived cell (CDC)-EVs, and the newt A1-EVs by fluorescent enzyme assays. (c and d) Graphical representation of the amount of RNA per particle (femtograms) and protein per particle (picograms) for NHDF-, CDC- and A1-EVs following the 3-day serum-starvation protocol of cultured cells. (e–h) Western blots of common EV surface proteins from A1 cells and EVs and mammalian NHDF cells and EVs are shown. This set of markers is comprised of thrombospondin1 (TSP1), periostin (POSTN), fibronectin (FN) and CD9. Example FACS bead assay histogram data with A1-EVs and NHDF-EVs stained to detect TSP1 (i), POSTN (j), FN (k) and CD9 (l). Quantitative measurements for abundance levels expressed as % of control antibody stains are indicated in green text for each FACS assay.
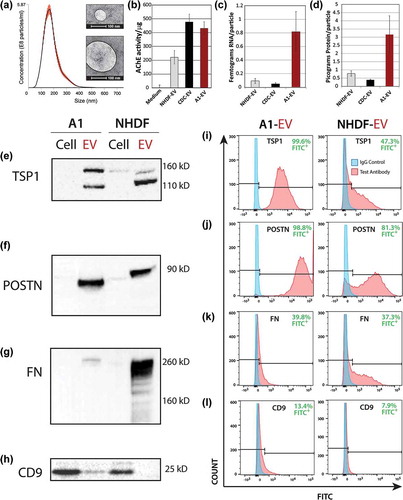
Figure 6. A1-EV surface marker profiles by nanoflow cytometry. Representative forward scatter (FSC) and side scatter (SSC) plots of A1-EV populations analysed with the MACSQuant nanoparticle flow cytometer for the expression of established EV surface markers, using a combination of primary and secondary antibodies. Newt A1-EVs were readily detectable above background noise as a separate population. (a) Gate settings for A1-EV FSC-A/SSC-A are shown on the left set of graphs and gate settings for fluorescent-positive particle gates are shown on the right side (boxed in green, with positive EVs also shown in green colour). These graphs show marker profiling for the control secondary antibody (AF488 2° only), TSP1, and POSTN. (b) Nanoflow cytometry analyses of A1-EVs using fluorescent-conjugated primary antibodies for control (no antibody), FN and CD81 surface antigens are shown.
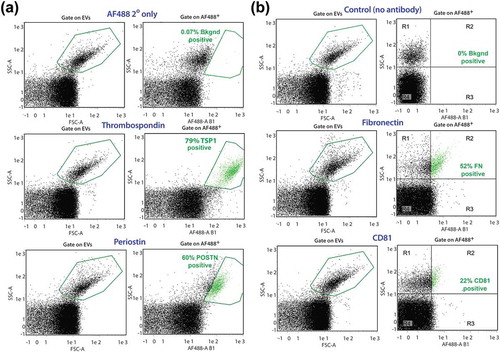
Figure 7. EV protein profiles as determined by mass spectrometry. (a) Proteomic profiles of A1-, CDC-, NHDF-EV protein contents identified by mass spectrometry and analysed for biological process classification using Functional Enrichment Analysis Tool (FUNRICH) software. The biological process class relative abundances for each EV source are displayed in pie graph forms. (b) Venn diagram displaying the proportion of proteins shared and unique to each EV type. Two hundred ninety-seven proteins were identified as being unique to A1-EVs. (c) These unique A1 EV proteins were further classified based on their biological function with the percentage of each functional group displayed and a complete list of these proteins are listed in the table shown in (d).
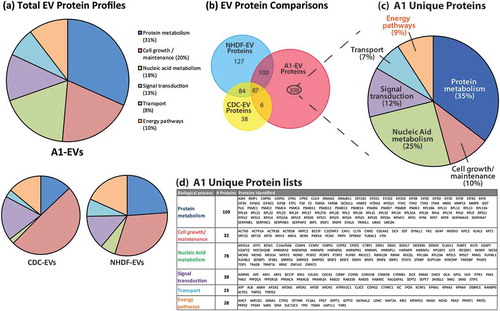
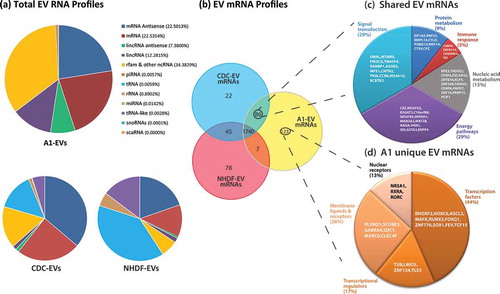
Figure 8. EV RNA profiles as determined by RNA sequencing. (a) Profiles of total RNA types identified by RNA-Seq and analysed via the Maverix Biomics exosome RNA data analysis pipeline from A1-, CDC- and NHDF-EVs and RNA type identified by mapping to the human genome. Relative abundances of RNA types are shown in pie graph form. (b) Venn diagram displaying the proportion of messenger RNAs shared and unique to each EV type. (c) 86 mRNAs were shared between the EVs derived from the stem cell-like CDCs and A1 myogenic precursor cells. From this group, the mRNAs were classified based on the biological function of their translated proteins (FUNRICH), and the five largest categories are displayed in pie chart format, with the corresponding mRNAs listed within the appropriate pie slice. (d) 123 unique A1-EV mRNAs were identified and further classified based on the biological function of their translated proteins (FUNRICH), and the five largest categories are displayed in pie chart format, with the corresponding mRNAs listed within the appropriate pie slice.