Figures & data
Table 1. Clinical classification of the samples.
Figure 1. Size distribution of urinary EVs isolated from the BPH and PCa groups.
Pairwise comparison BPH vs PCa stage 2 without perineural invasion (a), pairwise comparison BPH vs PCa stage 2 with perineural invasion (b) and pairwise comparison BPH vs PCa stage 3 (c). Size distribution of the particles isolated from each patient, including SEM error bars (d). Number of samples: BPH (n = 14), Stg.2 Pn0 (n = 6), Stg.2 Pn1 (n = 10) and Stg.3 (n = 13), all of them analysed in duplicate. Kruskal-Wallis Rank Sum test was applied to study the significance of the sizes distribution differences (*p < 0.05 and **p < 0.01).
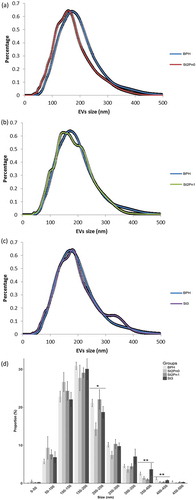
Figure 2. Volcano plot for BPH (n = 14) vs PCa (n = 31).
Positive fold change indicates an increase of the metabolite in PCa, while a negative value indicates that the levels are reduced in PCa. Dots shape and colour depend on metabolite families.
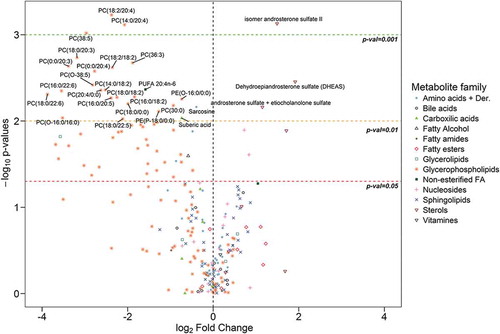
Figure 3. Metabolites associated to urinary EVs differentially expressed between BPH (n = 14) and PCa samples (n = 31).
Bars have been coloured depending on the significance of the differences, being lighter gray for the p-values between 0.05 and 0.01, medium gray for p-values between 0.01 and 0.001 and darker gray for p-values lower than 0.001.

Figure 4. Score (a) and loadings (b) plots of PCA model for the comparison PCa (n = 31) vs BHP (n = 14).
Dots in score plot (A) have been coloured depending on its group (PCa or BHP). Markers in loadings plot (B) have been coloured depending on metabolite family. AA (amino acids), AC (acyl carnitines), BA (bile acids), Carb (carboxylic acids), CCM (derivative carboxilic acids), Cer (ceramides), CMH (monohexosylceramides), DAPC (diacylglycerophosphocholines), DAPE (diacylglycerophosphoethanolamines), DAPI (diacylglycerophosphoinositol), DG (diacylglycerols), Exog. (exogenous), FAA (fatty amides), FFA (non-esterified fatty acids), MAPC (1-monoacylglycerophosphocholine), MAPE (monoacylglycerophosphoethanolamine), MAPI (monoacylglycerophosphoinositol), MEMAPC (1-ether, 2-acylglycerophosphocholine), MEMAPE (1-ether, 2-acylglycerophosphoethanolamine), MEPC (1-monoetherglycerophosphocholine), MEPE (1-monoetherglycerophosphoethanolamine). See more details of the nomenclature in supplemental material.
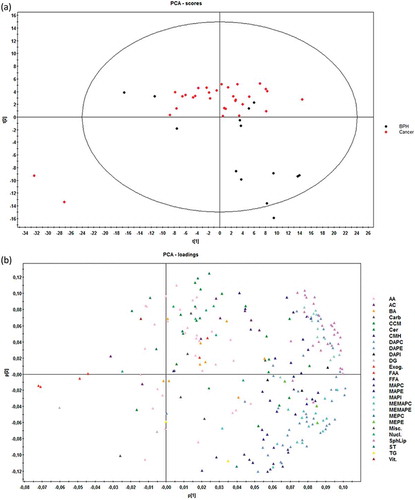
Figure 5. Differentially-expressed metabolites.
Box-plots of differentially expressed metabolites between PCa stages (A) (stage 2 n = 16 and stage 3 n = 15) and of differentially expressed metabolites between the presence and absence of perineural invasion (B) (Pn0 n = 6 and Pn1 n = 10). Significance is indicated next to metabolite name.
Table 2. Correlation analysis of metabolites and BMI.
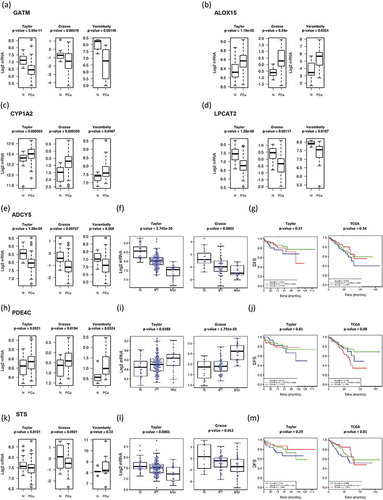
Figure 6. Gene-enrichment analysis.
In-silico transcriptomics analysis of enzymes directly involved in the metabolism of metabolites differentially expresed between PCa and BPH samples.