Figures & data
Table 1. Comparative mass spectrometry analysis of the 150k pellet isolated from EPC-CM and HUVEC-CM reveal abundant laminin-α1 peptides. Upper 20 lanes (red and white) correspond to proteins identified in the EPC 150k pellet with the highest score in the mass spectrometry analysis, and for which no orthologous protein was identified in the HUVEC 150k pellet. Lower lanes (green) correspond to four known EV markers identified in the EPC 150k pellet. Syntenin-1 and CD9 were also identified in the HUVEC 150k pellet.
Figure 1. EVs isolated from EPC-CM display exosomal properties.
(A) Quantification and size distribution of EVs obtained by Nanoparticle Tracking analysis using a Zetaview (Particle Metrix). Results are presented as the number of particles per 106 producing cells. (B) Representative scanning electron microscopy image of the 150k pellet obtained from EPC-CM. Enlarged view of the boxed area is shown at the right panel. EVs are indicated by arrows. (C) Western blot analysis of calnexin (ER marker) and flotilin-1, CD63 and CD9 (EVs markers) in two EPCs and two EPC-EV lysates. (D) Western blot analysis of CD63 on eight fractions (F1–F8) resolved by floatation in iodixanol density gradient. Density of the eight fractions is shown in the upper graph.
Figure 2. EPC-EVs are taken up by embryonic thyroid progenitors and stimulate folliculogenesis.
(A) Immunofluorescence for CD63 (red) of cultured embryonic thyroid progenitors without (left panel) or after incubation with PKH67-labeled EVs (green; right panel). Cell contours are delineated by dotted lines. Note clustering around cell. High magnifications of the boxed areas at left are shown at right in single channels for CD63 and PKH signals. (B) Immunofluorescence on sections of thyroid explants cultured without (control) or with EPC-EVs for E-cadherin (red) to define epithelial cells and ezrin (green) to identify their apical pole, thus lumen contour. (C) Folliculogenic index in control- and EPC-EVs-treated explants determined by quantification of ezrin+ open follicles (***p < 0.001; n = 5).
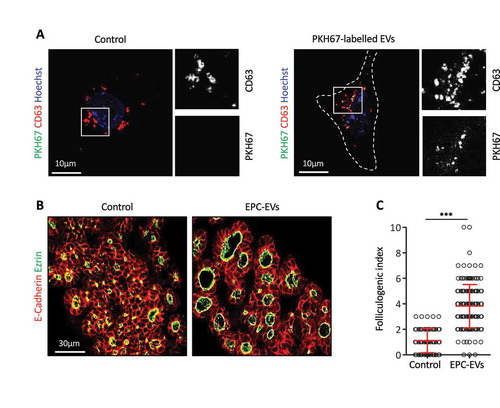
Figure 3. Depletion of EVs in the EPC-CM abrogates folliculogenic activity.
(A) Silver staining and western blot analysis using CD63 and laminin-α1 antibodies on equal volume of 10× EPC-CM, 10× EV-low EPC-CM and 20× EPC-EVs. (B) Quantification and size distribution of particles in EPC-CM, supernatant (EV-low EPC-CM) and 150k pellet from ultracentrifuged EPC-CM (EPC-EVs), obtained by Nanoparticle Tracking analysis using a Zetaview (Particle Metrix). (C) Immunofluorescence of whole thyroid explant cultured without (Control) or with EPC-EVs (20X concentration) or EV-low EPC-CM (10× concentration). Epithelial cells (E-cadherin) are visualised in red and their apical pole (ezrin) is labelled in green. (D) Quantification of the folliculogenic effect of EPC-EVs and EV-depleted EPC-CM (***p < 0.001; ** p < 0.01; six explants per condition were analysed in two independent experiments).
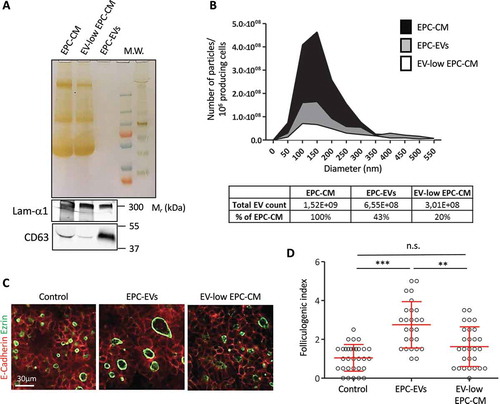
Figure 4. Knockdown of laminin-α1 in EPC abrogates folliculogenic activity of the 150k pellet.
(A) Western blot analysis of laminin-α1, CD63, flotilin-1 and CD9 on EPC-EVs, shα1-EVs and GipZ-EVs lysates, as compared to parental cell line lysates. (B) Quantification of laminin-α1 knockdown in infected cell lysates using GAPDH as a control (*p < 0.05; n = 4). (C) Immunofluorescence of thyroid explant sections after culture without (control) or with EPC-EVs, shα1-EVS or GipZ-EVs as indicated. Epithelial cells (E-cadherin) are labelled in red and their apical pole (ezrin), in green. (D) Quantification of the folliculogenic effect of EPC-EVs, shα1-EVs and GipZ-EVs (***p < 0.001; n = 5).
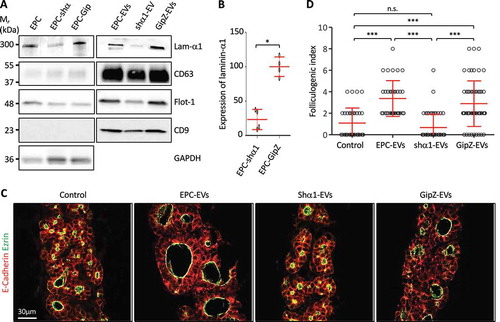
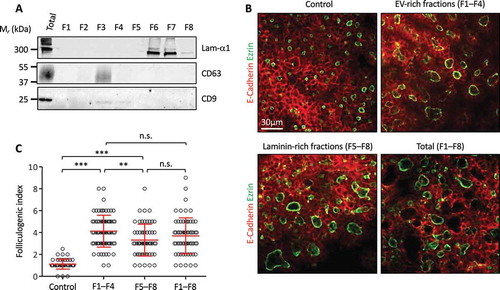
Figure 5. Independent effect of EPC-EVs and EPC-laminins on thyroid folliculogenesis.
(A) Western blot analysis of laminin-α1, CD63 and CD9 after separation of EPC-EVs by floatation on iodixanol gradient. (B) Immunofluorescence of whole thyroid explant cultured without (control) or with pooled fractions 1 to 4 (F1–F4), 5 to 8 (F5–F8) and 1 to 8 (F1–F8). Epithelial cells (E-cadherin) are labelled in red and their apical pole (ezrin) in green. A single section is shown for each condition. (C) Quantification of the folliculogenic effect of F1–F4, F5–F8 and F1–F8 (***p < 0.001; ** p < 0.01; n = 3).