Figures & data
Figure 1. Geographical distribution of respondents by ISEV geographical chapter. The pie chart represents percentage from each chapter: Asia-Pacific, Europe/Africa and the Americas.
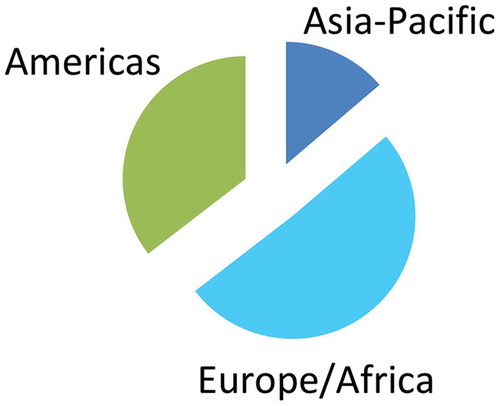
Figure 2. EV topics about which we know the “most” [Citation1] to the “least” [Citation5]. Respondents were required to rank the five topics from most [Citation1] to least knowledge [Citation2]. No rank could be used twice. Shown is the percentage of votes obtained by each. As depicted, biogenesis received the most votes for the best understood topic, while cargo loading and cargo transfer were thought to be least understood.
![Figure 2. EV topics about which we know the “most” [Citation1] to the “least” [Citation5]. Respondents were required to rank the five topics from most [Citation1] to least knowledge [Citation2]. No rank could be used twice. Shown is the percentage of votes obtained by each. As depicted, biogenesis received the most votes for the best understood topic, while cargo loading and cargo transfer were thought to be least understood.](/cms/asset/58a3f3e7-88a2-4ead-b46e-869689c818db/zjev_a_1535745_f0002_b.gif)
Figure 3. Factor(s) most responsible for observed effects of EVs. Respondents could select more than one answer. See supplementary material for selected comments.
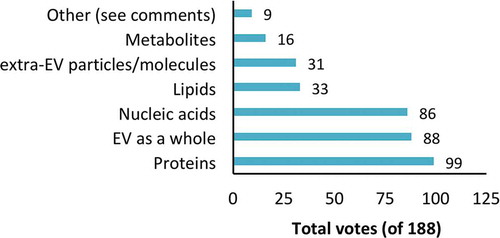
Figure 4. Factor(s) with the greatest biomarker potential. Respondents could select more than one answer. See supplementary material for selected comments.
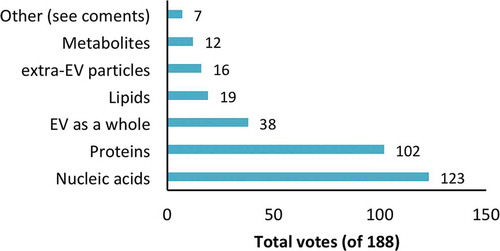
Figure 5. Is the recent emphasis on RNA justified? Only one answer was permitted. The pie chart represents percentage. Total numbers for each answer are given.
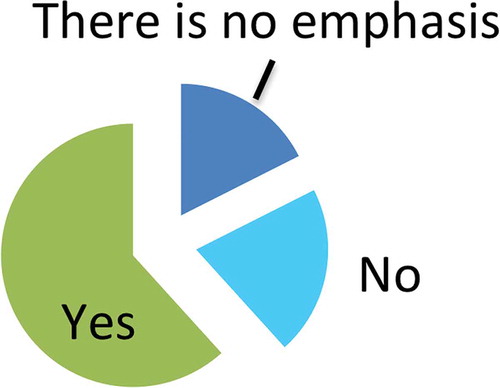
Table 1. Selected suggested protocols, resources and approaches.
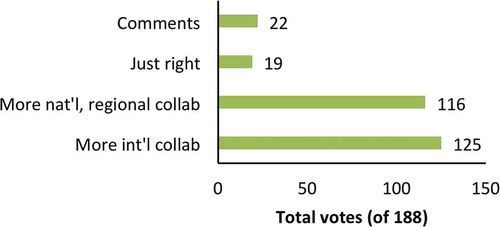
Figure 6. Collaboration needs. Respondents could select more than one answer. Abbreviations: national (nat’l), international (int’l). See supplementary material for selected comments.