Figures & data
Figure 1. Diagram of cross-flow filtration.
(a) A cross-flow chamber containing the input fluid (tissue culture supernatant, human plasma, tumour fluid, etc.) is pumped into a molecular weight cut-off filter. Molecules smaller than the size exclusion of the MW filter are sent to a waste chamber, whereas molecules larger than the size exclusion MW filter (in this case, EV) are returned to the cross-flow chamber. As the volume in the cross-flow chamber decreases, equilibration buffer is pumped in from the equilibration chamber. After equilibration buffer has been depleted, a final clarified product of concentrated EV can be used. (b) Particle size distribution (from cultured BCBL-1 cells) for Input 300 g and 50 g “Post-Clean” samples, with the modes arbitrarily standardized to 1 (N = 6). (c) Particle sizes were determined by NTA at progressive time points during the CFF concentration step. (d) Concentration of particles measured in each fraction during the CFF concentration step (N = 6).
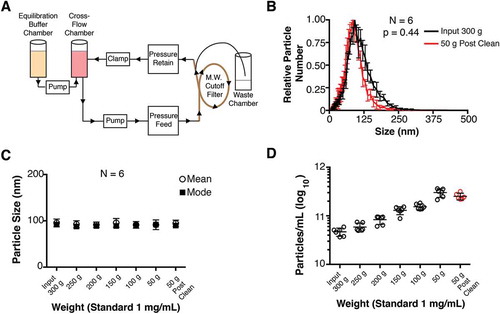
Table 1. List of antibodies used in this study, including their manufacturing origin, catalog numbers, and dilutions used.
Figure 2. Comparative analysis of EV isolation by ultracentrifugation (UC), polyethylene glycol precipitation (PEG) and CFF/PEG.
(a) Quantitative immunoblot of EV markers for EV obtained by the three methods ultracentrifugation = UC, direct PEG precipitation = PEG, and CFF followed by PEG precipitation = CFF/PEG. Each well represents a 800-fold concentration from the BCBL-1 cell culture supernatant by the three methods (b) Quantitation from (a) using Image Studio (ANOVA and T-tests, N = 3). (c) Size distribution analysis by NTA of EV isolated by the three first-step isolation methods with the modes being arbitrarily standardized to 1 (N = 6 for each group, ANOVA and integration T-tests were performed to identify statistical groups, indicated by a letter next to the isolation method in the legend). (d) Mean and mode particle sizes of the three isolation methods. (e) Total particle concentrations of the three first-step isolation methods (ANOVA and T-tests, N = 6).
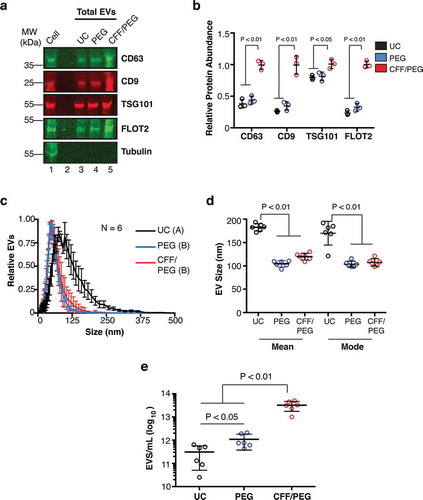
Figure 3. Characterization of a high-confidence “EV Pool” from Capto Core fractionates of the CFF/PEG EV.
(a) The EV pellet isolated via cross-flow filtration was added to high molecular weight cut-off Capto Core resin and fractions were collected and assayed for esterase activity (N = 6). An orange box highlighting fractions 2–8 of the Capto Core fractionates was added to indicate an “EV Pool” (b) Total particles/mL for each fraction, as measured by NTA (N = 6), with the “EV Pool” fractionates highlighted. (c) Mean and mode sizes of the particles in the fractions, as measured by NTA (N = 6), with the “EV Pool” fractionates highlighted. (d) Silver stain analysis of each fraction (gel is representative of 6 independent runs). (e) Quantitative immunoblot of the tetraspanin proteins CD63, CD9, and CD81 in the Capto Core fractions. (f) Band intensities from (e) were quantified in Image Studio. The highest band density was arbitrarily standardized to 1, with the “EV Pool” fractionates highlighted. (g) The KSHV-encoded microRNA miRK12-7 was quantified by RTq-PCR in each fraction, with the “EV Pool” fractionates highlighted. (h) Percent in the EV Pool for each assay was calculated. (i-l) hTERT-HUVECs were incubated with ExoGreen label + Mock (no EV and post filtration) for 12 h and single plane images were deconvoluted. The cells were stained for Actin (Rhodamine Phalloidin) (i), the ExoGreen marker (j), and nuclei (DAPI) (k). A composite image is shown in (l). (m-p) hTERT-HUVECs were incubated with unlabelled EV (post filtration) for 12 h and single plane images were deconvoluted. The cells were stained for Actin (Rhodamine Phalloidin) (m), the ExoGreen marker (n), and nuclei (DAPI) (o). A composite image is shown in (p). (q-t) hTERT-HUVECs were incubated with labelled CFF/PEG EV (post filtration) for 12 h and single plane images were deconvoluted (q-t). The cells were stained for Actin (Rhodamine Phalloidin) (q), the ExoGreen marker (r), and nuclei (DAPI) (s). A composite image is shown in (t).
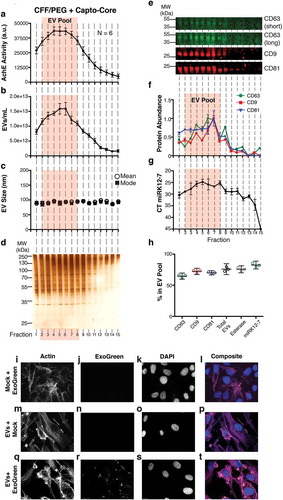
Figure 4. Final size comparison between EV isolated by the three methods.
(a) Plot of the NTA analysis of the diameter of final EV products isolated by UC, PEG, or by CFF/PEG + Capto Core filtration (ANOVA and T-tests, N = 6). (b) Plot of the TEM analysis of the diameter of final EV products isolated by UC, PEG, or by CFF/PEG + Capto Core filtration (Wilcoxon Rank Sum Test, N = 3). (c) Density and diameter plot of the EV visualized by TEM. The area under each curve was arbitrarily set to 1. Wilcox rank sum test was used to determine statistical significance between the three groups and are labelled by a letter next to the figure legend. All graphs and statistics were done in R (Wilcox Rank Sum Test/Integration-based T-test, N = 3). (d) EV purity analysis from three methods. A particle to protein calculation was conducted on the final products obtained from the three methods, as measured by NTA and BCA assay, respectively (ANOVA and T-tests, N = 3).
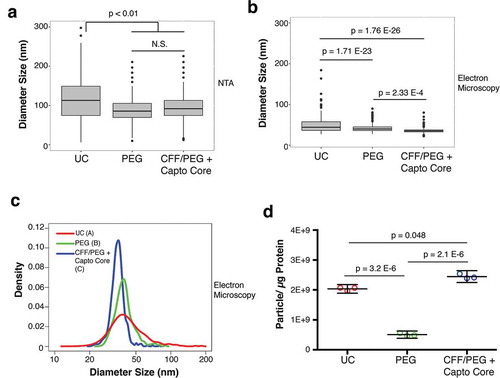
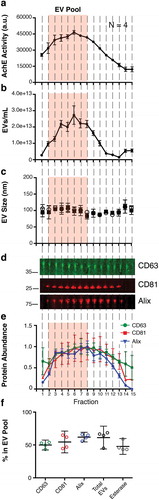
Figure 5. CFF/PEG + Capto Core can be used on human plasma for the isolation of EV from in vivo samples.
(a) The EV pellet from four healthy donors were isolated via cross-flow filtration was added to high molecular weight cut-off Capto Core resin and fractions were collected and assayed for esterase activity (N = 4). The orange “EV Pool” from was used to directly compare EV from tissue culture and EV from plasma. (b) Total particles/mL for each fraction, as measured by NTA (N = 4) (c) Mean and mode sizes of the particles in the fractions, as measured by NTA (N = 4) (d) Quantitative immunoblot of the tetraspanin proteins CD63, CD81, and Alix in the Capto Core fractions. (e) Band intensities from (d) were quantified in Image Studio. The highest band density was arbitrarily standardized to 1, with the “EV Pool” fractionates highlighted. (f) Percent in the EV Pool for each assay was calculated.