Figures & data
Figure 1. (a) Schematic overview of the experimental setup. Critical methodological parameters that are compared are indicated in red. (I) Suspensions of undiluted, 3.3× and 10× diluted FCS (100%, 30%, 10% FCS) were depleted from EV by overnight ultracentrifugation (15–18 h) at 100,000× g. EV-depleted supernatant was recovered from ultracentrifugation tubes by pipetting. EV-depleted supernatant fractions were diluted 3× or 10× before RNA isolation to correct for differences in FCS concentration. RNA was additionally isolated from pellet fractions and non-depleted medium (containing 10% FCS). (II) A suspension of diluted FCS (30%) was depleted from EV by overnight ultracentrifugation (15–18 h) at 100,000× g. EV depleted medium was recovered from ultracentrifugation tubes by pipetting or decanting and diluted three times before RNA isolation. RNA was isolated from EV-depleted supernatant and from non-depleted medium (10% FCS). (III) EV-depleted supernatant containing 30% FCS was used to prepare EV-depleted medium in which HEK293T and A20 cells were cultured 20 h for EV production. Identical volumes of cell conditioned EV-depleted medium or non-conditioned EV-depleted medium were subjected to differential (ultra)centrifugation and density gradient centrifugation to purify cell-derived and/or residual bovine EV. RNA was isolated from EV-containing density fractions (1.12–1.18 g/mL). (b) Representative Bioanalyser Pico chip electropherograms of RNA isolated from non-depleted medium (I), supernatant (II), and pellet (III) fractions of EV-depleted medium. (c) Suspensions of 100%, 30%, or 10% FCS were depleted from EV by overnight ultracentrifugation (15–18 h) at 100,000× g. EV-depleted supernatant was recovered from ultracentrifugation tubes by pipetting. Supernatant fractions were diluted 3x and 10x before RNA isolation to correct for differences in FCS concentrations. The concentrations of RNA in supernatants and pellets were assessed on Bioanalyser. Total RNA quantity in the entire ultracentrifuge tube was calculated by adding up the total RNA quantities in pellet and supernatant fractions, corrected for the dilution factor before RNA isolation. Indicated is the distribution of RNA over supernatant and pellet fractions for each of the FCS dilutions. Mean ± SD of n = 3 experiments, * p < 0.05 ANOVA with Dunnett’s one-sided post-hoc test (control condition: 100% EV-depleted supernatant). (d) Equal volumes of RNA isolated from EV-depleted supernatant of different FCS dilutions (prepared as described in (c), and RNA isolated from non-depleted medium (“medium”) were used for RT-qPCR analysis of the indicated RNAs. Depletion efficiencies were calculated from the raw Cq values shown in (e) using the ΔΔCq method [Citation33] relative to non-depleted medium. Indicated are mean log2fold change values ± SD of n = 3 experiments. Statistical differences were determined by ANOVA with Tukey HSD post-hoc test. * p < 0.05. No statistical differences were found between the depletion efficiencies in different FCS dilutions. (e) Raw Cq values of the RT-qPCR data shown in (d). Low Cq values mean high abundance. Indicated are mean values ± SD of n = 3 experiments. Statistical differences were determined by ANOVA with Tukey HSD post-hoc test. * p < 0.05 No statistical differences were observed between different FCS dilutions. (f) Suspensions of 30% FCS were depleted from EV by overnight ultracentrifugation (15–18h) at 100,000× g. EV-depleted supernatants were recovered from ultracentrifugation tubes by decanting (“sup decant”) or pipetting (“sup pipette”). RNA was isolated from EV-depleted supernatants collected by decanting and pipetting (equilibrated to 10% FCS) and from non-depleted medium (containing 10% FCS). Equal volumes of RNA were used for RT-qPCR analysis of the indicated RNAs. Log2fold change levels relative to non-depleted medium were calculated as in (d). Indicated are mean values ± SD of n = 3 experiments. Statistical differences were determined by ANOVA with Tukey HSD post-hoc test, * p < 0.05.
![Figure 1. (a) Schematic overview of the experimental setup. Critical methodological parameters that are compared are indicated in red. (I) Suspensions of undiluted, 3.3× and 10× diluted FCS (100%, 30%, 10% FCS) were depleted from EV by overnight ultracentrifugation (15–18 h) at 100,000× g. EV-depleted supernatant was recovered from ultracentrifugation tubes by pipetting. EV-depleted supernatant fractions were diluted 3× or 10× before RNA isolation to correct for differences in FCS concentration. RNA was additionally isolated from pellet fractions and non-depleted medium (containing 10% FCS). (II) A suspension of diluted FCS (30%) was depleted from EV by overnight ultracentrifugation (15–18 h) at 100,000× g. EV depleted medium was recovered from ultracentrifugation tubes by pipetting or decanting and diluted three times before RNA isolation. RNA was isolated from EV-depleted supernatant and from non-depleted medium (10% FCS). (III) EV-depleted supernatant containing 30% FCS was used to prepare EV-depleted medium in which HEK293T and A20 cells were cultured 20 h for EV production. Identical volumes of cell conditioned EV-depleted medium or non-conditioned EV-depleted medium were subjected to differential (ultra)centrifugation and density gradient centrifugation to purify cell-derived and/or residual bovine EV. RNA was isolated from EV-containing density fractions (1.12–1.18 g/mL). (b) Representative Bioanalyser Pico chip electropherograms of RNA isolated from non-depleted medium (I), supernatant (II), and pellet (III) fractions of EV-depleted medium. (c) Suspensions of 100%, 30%, or 10% FCS were depleted from EV by overnight ultracentrifugation (15–18 h) at 100,000× g. EV-depleted supernatant was recovered from ultracentrifugation tubes by pipetting. Supernatant fractions were diluted 3x and 10x before RNA isolation to correct for differences in FCS concentrations. The concentrations of RNA in supernatants and pellets were assessed on Bioanalyser. Total RNA quantity in the entire ultracentrifuge tube was calculated by adding up the total RNA quantities in pellet and supernatant fractions, corrected for the dilution factor before RNA isolation. Indicated is the distribution of RNA over supernatant and pellet fractions for each of the FCS dilutions. Mean ± SD of n = 3 experiments, * p < 0.05 ANOVA with Dunnett’s one-sided post-hoc test (control condition: 100% EV-depleted supernatant). (d) Equal volumes of RNA isolated from EV-depleted supernatant of different FCS dilutions (prepared as described in (c), and RNA isolated from non-depleted medium (“medium”) were used for RT-qPCR analysis of the indicated RNAs. Depletion efficiencies were calculated from the raw Cq values shown in (e) using the ΔΔCq method [Citation33] relative to non-depleted medium. Indicated are mean log2fold change values ± SD of n = 3 experiments. Statistical differences were determined by ANOVA with Tukey HSD post-hoc test. * p < 0.05. No statistical differences were found between the depletion efficiencies in different FCS dilutions. (e) Raw Cq values of the RT-qPCR data shown in (d). Low Cq values mean high abundance. Indicated are mean values ± SD of n = 3 experiments. Statistical differences were determined by ANOVA with Tukey HSD post-hoc test. * p < 0.05 No statistical differences were observed between different FCS dilutions. (f) Suspensions of 30% FCS were depleted from EV by overnight ultracentrifugation (15–18h) at 100,000× g. EV-depleted supernatants were recovered from ultracentrifugation tubes by decanting (“sup decant”) or pipetting (“sup pipette”). RNA was isolated from EV-depleted supernatants collected by decanting and pipetting (equilibrated to 10% FCS) and from non-depleted medium (containing 10% FCS). Equal volumes of RNA were used for RT-qPCR analysis of the indicated RNAs. Log2fold change levels relative to non-depleted medium were calculated as in (d). Indicated are mean values ± SD of n = 3 experiments. Statistical differences were determined by ANOVA with Tukey HSD post-hoc test, * p < 0.05.](/cms/asset/46a523ce-2244-416a-bebe-5e7cd62b7e6b/zjev_a_1552059_f0001_oc.jpg)
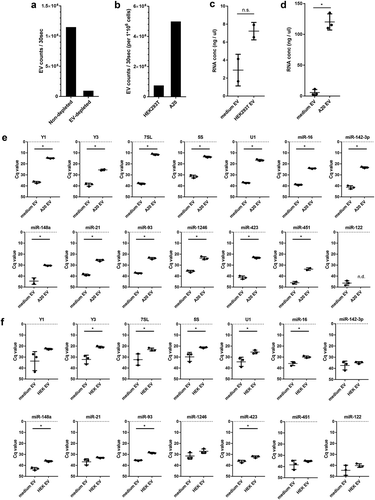
Figure 2. (a) EV-depleted medium was prepared using supernatant of ultracentrifuged solutions of 30% FCS. EV from equal volumes of EV-depleted and non-depleted medium were isolated by ultracentrifugation, fluorescently labelled with PKH67, and further purified by sucrose density gradient centrifugation. High-resolution flow cytometry was used to determine the number of PKH67-labeled EV. Indicated are the number of fluorescent EV detected in 30 s in pools of 1.12–1.18 g/mL sucrose fractions. (b) HEK293T and A20 cells were grown 20h in EV-depleted medium (prepared from 30% EV-depleted FCS). EV were isolated from equal volumes of HEK293T and A20 cell-conditioned supernatant, labelled with PKH67, and quantified using high-resolution flow cytometry. Indicated are the number of fluorescent EV in 30 s in pools of 1.12–1.18 g/mL sucrose fractions, normalised to the number of cultured cells to allow direct comparison of EV-release by both cell types. (c, d) HEK293T cells or A20 cells were cultured in EV-depleted medium (prepared from 30%-depleted FCS). EV were isolated from equal volumes of HEK293T (c) or A20 (d) conditioned medium and non-conditioned medium using differential centrifugation followed by sucrose density gradient centrifugation. RNA was isolated from EV pelleted from 1.12–1.18 g/mL sucrose fractions. Indicated are mean RNA concentrations ± SD of n = 2 (HEK293T) or n = 3 (A20) replicates. Statistical differences were determined by independent samples t-test, * p < 0.05. (E, F) EV-RNA isolated from A20 (e) and HEK293T (f) conditioned medium and equal volumes of non-conditioned EV-depleted medium (prepared as in d) were used for analysis of the indicated RNAs using RT-qPCR. Indicated are mean Cq values ± SD of n = 3 replicates. Statistical differences were determined by independent samples t-test, * p < 0.05.