Figures & data
Figure 1. Characterisation of EVs isolated using the precipitation method. (a) Scanning electron microscopy (SEM) images of the isolated EV fraction show round vesicle-like particles (black arrows) and smaller background particles. Scale bar: 200 nm in all panels. (b) Nanoparticle tracking analysis (NTA) showed that the size of most particles ranged from 60–120 nm, which is comparable to that measured with SEM. Data are expressed as the mean ± standard error of the mean. (c) SDS-PAGE of proteins in trunk plasma (P), EV pellet (EV), and the remaining supernatant (S). Each lane was loaded with 5 µg protein. Note that almost all protein bands present in plasma were also observed in the EV-pellet. (d) Western blot analysis showed no signal on EV-marker tsg-101, reduced signal in the albumin and enrichment of the HDL marker ApoA1 in the EV pellet. Rat cortex lysate (C) was used as a positive control for tsg-101.
Figure 2. (a) Transmission electron microscopy (TEM) analysis of the precipitation-isolated EV pellet showed round particles, presumably lipoproteins (marked with black arrows), and a few cup-shaped particles (marked with white arrows). The “dense smudge” background indicates protein contamination. (b) Plasma size-exclusion chromatography (SEC). The relative number of particles measured with nanoparticle tracking analysis indicated the highest particle count in fractions 12–15 and the highest protein concentration in fractions 18–22. Fractions marked with black boxes were pooled and concentrated for TEM imaging. Data are from one series of SEC fractions. Three 30-sec videos were recorded by NTA for each fraction. Data are expressed as the mean ± standard error of the mean. (c) TEM analysis of SEC fractions 6–7 showed a few cup-shaped vesicles (white arrows) and round lipoprotein-like particles (black arrows). In fractions 8–10 (d) and 12–13 (e) cup-shaped EVs were not found, but were lipoprotein-like particles were observed (black arrows). Particle size distribution from SEC fractions (f) 6–7, (g) 8–10 and (h) 12–13 measured with nanoparticle tracking analysis showed that the proportion of larger particles (>100 nm) was higher in earlier fractions and that of <60 nm particles increased in the later fractions. Fractions are the same as in Figure 2 B. Data from three 30-second videos recorded by NTA are expressed as the mean ± standard error of the mean.
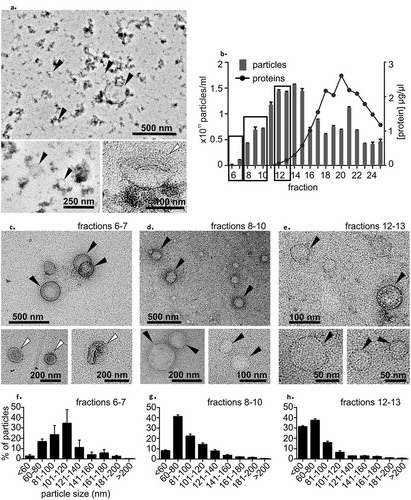
Figure 3. (a) A precipitation-based isolation method was evaluated using size-exclusion chromatography (SEC). Plasma from individual rat was divided in two 800 µl aliquots and the first aliquot was analysed with SEC (plasma-SEC). EVs from the second aliquot was first isolated using precipitation-based kit and the EV pellet was further analysed with SEC (EV-SEC). (b) Measurement of the protein concentration in each fraction showed that precipitation isolation removed 85% to 91% of the total plasma proteins. (c) Nanoparticle tracking analysis (NTA) indicated that the total number of particles was comparable in the plasma-SEC and EV-SEC, but the main peak moved towards later fractions in EV-SEC. The figures present four individual rats (biological replicates). Data are expressed as the mean ± standard error of the mean. Black box indicates the EV-rich fractions.
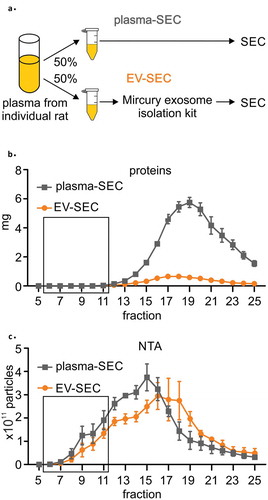
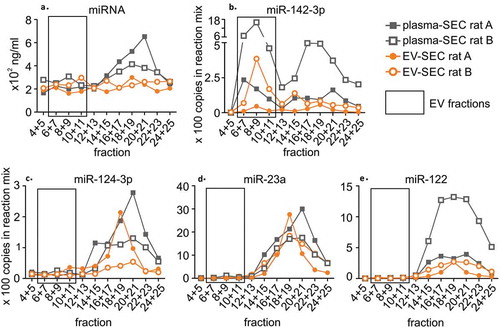
Figure 4. A precipitation-based isolation method was evaluated using size-exclusion chromatography (SEC). Plasma was divided in two 800 µl aliquots, and the first aliquot was analysed with SEC (plasma-SEC). EVs from the second aliquot was first isolated using precipitation-based kit and the EV pellet was further analysed with SEC (EV-SEC). RNA was isolated from combined adjacent fractions. The analysis was made for two individual rats (rat A and B). (a) The miRNA concentration peaked in the protein fractions in plasma-SEC, whereas no clear peak was in the EV-SEC. (b) Droplet digital PCR analysis of miR-142-3p showed the highest peaks in the EV fractions (6–11). The total amount of miR-142-3p appeared lower in the EV-SEC fractions. (c) miR-124-3p, (d) miR-23a and (e) miR-122 were found in protein-rich fractions in both plasma-SEC and EV-SEC.