Figures & data
Table 1. Preparation protocols for transmission electron microscopy of extracellular vesicles.
Figure 1. Experimental setup. A single urinary EV sample was thawed and centrifuged to remove precipitated salts. The supernatant was concentrated by a double ultracentrifugation step. Next, the pellet was divided over four Eppendorf tubes to perform the TEM preparation protocols (A–D). From each protocol three grids were imaged at one operator-selected location and at five predefined locations per grid. This resulted in a total of 18 images per protocol.
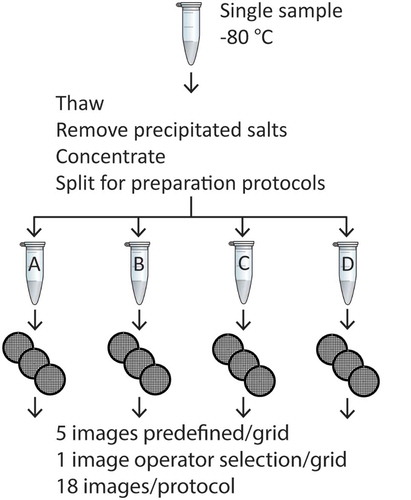
Figure 2. Impact of magnification on image quality. The operator selected an image location containing a high number of EVs and relatively low background, and imaged this location at magnifications of 150,000×, 98,000× and 49,000×. The insets show the same 230 × 230 nm area at each magnification. The contrast and sharpness of the image decrease at lower magnification. However higher magnification reduces background if the background is no longer part of the image area.
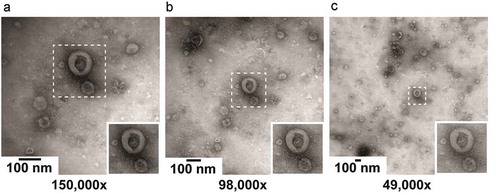
Figure 3. Overview of images after operator image selection. TEM images obtained from a single urinary EV sample by the four evaluated protocols. The white outlines indicate the image that we would normally show. The overview image is typically shown in Supplemental Material to “show the heterogeneity of the sample". Panel letters correspond to protocol name, scale bar represents 1 µm and is the same for all images.
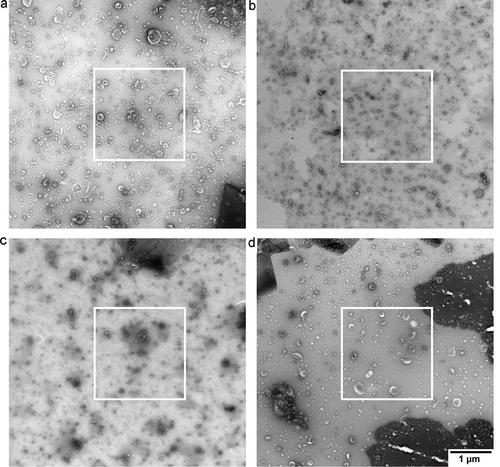
Figure 4. TEM images obtained with protocol A. TEM images obtained after operator image selection and at predefined locations for three grids. Scale is the same for all images, bar represents 500 nm.
Figure 5. TEM images obtained with protocol B. TEM images obtained after operator image selection and at predefined locations for three grids. Scale is the same for all images, bar represents 500 nm.
Figure 6. TEM images obtained with protocol C. TEM images obtained after operator image selection and at predefined locations for three grids. Scale is the same for all images, bar represents 500 nm.
Figure 7. TEM images obtained with protocol D. TEM images obtained after operator image selection and at predefined locations for three grids. Scale is the same for all images, bar represents 500 nm.
Table 2. Statistical comparisons between grids of each protocol (ANOVA), between operator selected and predefined locations (student’s t-test) and between protocols (student’s t-test).
Figure 8. Summary of image properties by protocol and grid. Total number of EV per image (a), % cup-shape of total EVs per image (b), image quality (c) and background quality (d) are shown for the four TEM preparation protocols. Each symbol represents one image. Circles indicate images taken at predefined locations, x indicates operator image selection. Horizontal bar shows the mean value of predefined image locations per grid.