Figures & data
Figure 1. Protein and particle content in samples obtained from rat blood plasma using size exclusion chromatography (SEC) or ultracentrifugation (UC).
Protein content was measured by BCA assay and particle concentration and size by NTA. (a): Protein amount in SEC fractions 3.5–7.5 ml and UC samples. n = 6. (b): Particle number in SEC fractions 3.5–7.5 ml and UC samples. n = 6. (c): Particle/protein ratio for SEC fractions 3.5–7.5 ml and UC samples. n = 6. (d): Particle size distribution for SEC fractions 5.0–5.5 ml and UC demonstrates the presence of particles in the typical sEV range. SEC fractions 5.0 and 5.5 ml were used due to their high particle/protein ratio. n = 6–12, curve shows mean values. (e): Modal size of the particles isolated from SEC (5.0–5.5 ml) and UC. *p < 0.05; Student’s t-test. n = 6–12.
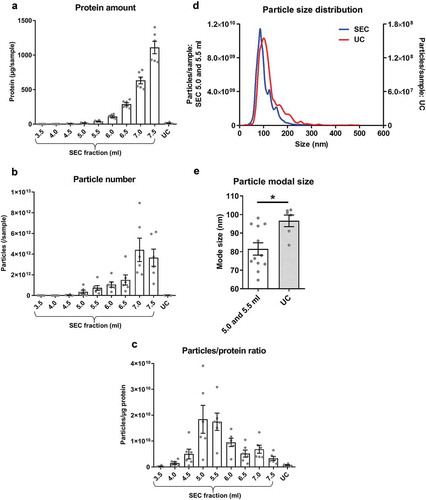
Figure 2. sEV content, as determined by the expression of marker proteins, in rat blood plasma samples obtained using SEC or UC.
(a,b): sEV (CD81 – panel (a), HSP70 – panel (b)) markers were measured by DELFIA for SEC fractions 4.0–7.0 ml and UC samples. AU – arbitrary units normalised to volumes in each sample. n = 6. (c): UC sEV yield presented as a % of combined SEC fractions 5.0–6.5 ml CD81 and HSP70 signal (data from (a) and (b)). n = 6. (d,e): Absorbance of SEC samples at 260 nm (A260), representing relative nucleic acid concentrations; and at 280 nm (A280), representing relative protein concentrations. Note the presence of early peaks at both A260 and A280 which coincide with the CD81 and HSP70 marker signal peaks (data from panels (a) and (b), dashed lines). n = 6. (f): Correlation between HSP70 and CD81 signal. SEC fractions 4.0–7.0 ml and UC samples included. p < 0.0001; Spearman’s correlation test, Spearman r = 0.958. n = 48. (g): sEV marker signal (from panels (a) and (b)) was normalised to total protein amount for the peak sEV SEC fractions 5.0–6.0 ml as well as for the UC samples. n = 6.
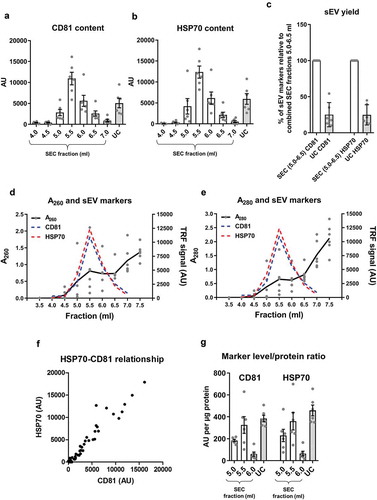
Figure 3. Lipoprotein content in samples of rat blood plasma obtained with SEC or UC.
(a): APOB as a marker of lipoproteins measured by DELFIA for SEC fractions 4.0–7.0 ml and UC samples. AU – arbitrary units normalised to volumes in each sample. n = 6. (b): APOB lipoprotein marker signal was normalised to total protein amount for the peak sEV SEC fractions 5.0–6.0 ml as well as for the UC samples. n = 6. (c): UC sample visual appearance compared to pooled and concentrated SEC fractions 3.5–6.0 ml. Note the opaque appearance of the SEC sample indicative of the presence of lipids.
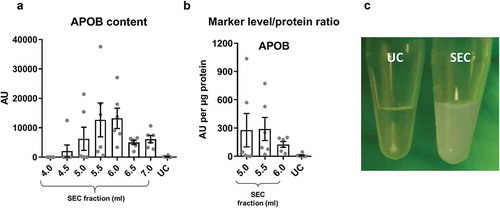
Figure 4. Summary of yield and purity of sEVs isolated by SEC or UC.
Summarised key points from to . sEV yield (left panel, see )), protein contamination (middle panel, see )) and lipoprotein contamination (right panel, see ) and ) shown for the peak sEV fractions (5.0, 5.5 and 6.0 ml) of SEC and UC samples. CD81 signal was used as an estimate of sEV content.
Figure 5. Western blotting and electron microscopy of rat blood plasma samples obtained with SEC or UC.
(a): Wes™ Simple Western (ProteinSimple; see Methods for details) for APOB (left), HSP70 (right, top), alpha-Actinin-4 (right bottom) of UC and pooled SEC (3.5–6.0 ml) samples. (b): TEM images of SEC fractions 4.0, 5.5 and 8.0 ml (top panels) and UC-sEVs (bottom panels). Arrows indicate lipoprotein-resembling structures. Arrowheads indicate sEVs. Scale bar: 200 nm.
Figure 6. Correlation of sEV marker signal and particle or protein concentration of vesicles isolated by UC of rat blood plasma.
Particle (left panels) or protein (right panels) concentration of UC samples plotted against CD81 (a) or HSP70 (b) marker signal. Positive correlations were found for all four panels ((a): CD81 vs particles: p < 0.001; Pearson’s correlation test, Pearson r = 0.975. CD81 vs protein: p < 0.01; Pearson’s correlation test, Pearson r = 0.938. (b): HSP70 vs particles: p < 0.0001; Pearson’s correlation test, Pearson r = 0.996. HSP70 vs. protein: p < 0.05; Pearson’s correlation test, Pearson r = 0.899).
Figure 7. Correlation of sEV marker signal and particle or protein concentration of vesicles isolated by SEC of rat blood plasma.
Particle (left panels) or protein (right panels) concentration of peak sEV-SEC fractions 5.0 ml (a), 5.5 ml (b) and 6.0 ml (c) plotted against CD81 (top panels) or HSP70 (bottom panels) marker signal. Positive correlations were found for all four panels in (a) (CD81 vs particles: p < 0.001; Pearson’s correlation test, Pearson r = 0.983. CD81 vs protein: p < 0.001; Pearson’s correlation test, Pearson r = 0.990. HSP70 vs. particles: p < 0.001; Pearson’s correlation test, Pearson r = 0. 0.978. HSP70 vs. protein: p < 0.01; Pearson’s correlation test, Pearson r = 0.963). No positive correlations were found in panels (b) and (c) (p > 0.05; Pearson’s or Spearman’s correlation test as required, except top right panels where CD81 signal and protein concentration correlated negatively, p < 0.01; Pearson’s correlation test, Pearson r = −0.937 for top right panel in (b) and p < 0.05; Spearman’s correlation test, Spearman r = −0.943 for top right panel in (c)).
Figure 8. Characterisation of sEVs isolated by SEC or UC for use in endothelial cell migration experiments.
For SEC isolation of sEVs, 1 ml of plasma was loaded on a SEC column and fractions 4.0–6.0 ml were collected, pooled and concentrated on Vivaspin-4 ultrafiltration units (100 kDa cut-off). For UC isolation of sEVs, 4 ml of starting plasma volume were used. (a): Protein amount in SEC and UC samples measured by BCA assay. n = 4. **p < 0.01. (b): Particle number in SEC and UC samples measured by NTA. n = 4. *p < 0.05. (c): sEV (CD9, CD81, HSP70) and lipoprotein (APOB) markers measured by DELFIA for SEC and UC samples. AU – arbitrary units normalised to volumes in each sample. n = 4. Note the marker levels were also normalised to starting plasma volumes and represent the yield of sEV and lipoproteins from 1 ml plasma. (d): Particle/protein ratio for SEC and UC samples. n = 4. **p < 0.01. (e): sEV marker signal normalised to total protein amount for SEC and UC samples as a measure of purity of sEVs from soluble protein. Note the higher sEV/total protein content in UC samples despite the lower particle to protein ratio (panel (d)). **p < 0.01 UC CD9 vs. SEC CD9, *p < 0.05 UC CD81 vs. SEC CD81 and ***p < 0.001 UC HSP70 vs. SEC HSP70, Student’s t-test.
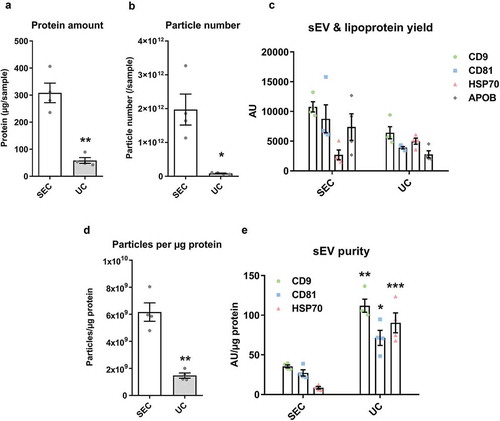
Figure 9. SEC-sEVs and UC-sEVs promote migration of endothelial cells in vitro.
(a) modified Boyden’s Chamber assay was employed to study HUVEC migration in response to SEC- and UC-isolated sEVs. 1 × 10¹⁰ particles/ml were used for the UC group. SEC-isolated sEVs were adjusted to match the UC sample in terms of particle number (“SEC: equal particles”), CD81 content (“SEC: equal CD81”) or protein content (“SEC: equal protein”). Vehicle group contained PBS. Relative levels of SEC-sEV dose-response are: “SEC: equal protein” = ~4× “SEC: equal particles” and “SEC: equal CD81” = ~11× “SEC: equal particles” (a): All groups showed higher HUVEC migration than Vehicle control (*p < 0.05, UC vs Vehicle; **p < 0.01, SEC: equal particles vs. Vehicle; ***p < 0.001, SEC: equal CD81 vs. Vehicle and SEC: equal protein vs. Vehicle, one-way repeated measures ANOVA with Tukey’s post-hoc test, n = 5). SEC: equal protein induced more HUVEC migration than the UC group ($ p < 0.05, one-way repeated measures ANOVA with Tukey’s post-hoc test, n = 5). Data are presented as whole-well staining intensities normalised to a positive control (10% FBS). (b): Representative microscopy pictures confirming the data shown in (a). Scale bar: 200 µm.
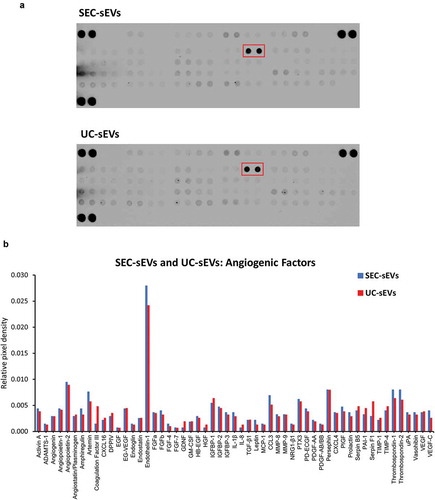
Figure 10. Angiogenic factors present in SEC-sEVs and UC-sEVs isolates.
~20 µg protein of SEC-sEVs or UC-sEVs samples isolated for functional studies (see and Supplementary Figure 3) were incubated on ARY007 protein array membranes (R&D Systems). Relative levels of 55 angiogenesis-related factors were quantified and presented. (a): Array membrane images. The red box indicates the most abundant protein – endothelin-1. (b): Quantification of panel (d). Relative pixel densities represent mean duplicate spot pixel densities normalised to Reference Control spots.