Figures & data
Table 1. Fluorescence dyes, primary and secondary antibodies used for Western blot, flow cytometry and fluorescence microscopy.
Figure 1. Characterisation and purification of SF-EVs. (a) Average size distribution of SF-EVs per sample (n = 11), analysed by nanoparticle tracking analysis (NTA) at camera level 12. (b) Western blot (10 μg) analysis of exosomal markers ALIX, SYNTENIN-1, CD9 and CD81 in SF-EV preparations (n = 11). (c) Purification of pooled bio-maleimide-labeled SF-EVs (n = 11) using Exo-spinTM columns. SF-EVs were eluted with PBS and 30 fractions of 500 μl collected. Protein concentrations (dashed grey line) were determined using a BCA assay and SF-EV concentrations (solid black line) measured by NTA. (d) Mean and mode size of SF-EVs before and after Exo-spinTM column purification. The samples were analysed by NTA. Bars represent mean ± SEM (n = 4). (e) Western blot (5 μg) analysis of exosomal markers ALIX, SYNTENIN-1, CD9 and CD81 in pooled SF-EVs before (a) and after (b) purification.
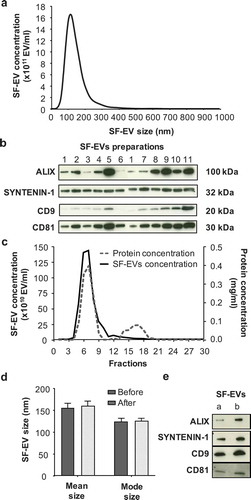
Figure 2. Electron microscopy images of SF-EV (a) non-labelled and (b) bio-maleimide-labelled pooled SF-EVs (n = 11) were analysed by transmission electron microscopy. SF-EVs between 20 and 300 nm in size were detected and protein aggregates were not found. Arrows mark SF-EVs detected in the samples.
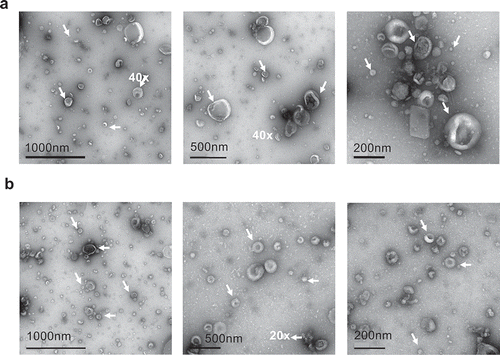
Figure 3. Flow cytometric analysis of SF-EV binding to primary ESCs (a) nondecidualised, (b) day 3 and (c) day 7 decidualised ESCs were incubated with bio-maleimide-labelled SF-EVs (5 × 10¹⁰ SF-EVs/106 cells), PBS or the negative control for 2 h and then analysed by flow cytometry. Bars represent mean ± SEM. *p < 0.05, **p < 0.01. (d) Representative flow cytometry histogram overlay image of SF-EV binding to primary ESCs on non-decidualised, day 3 and 7 decidualised ESC (blue line = PBS control; red line = + SF-EV).
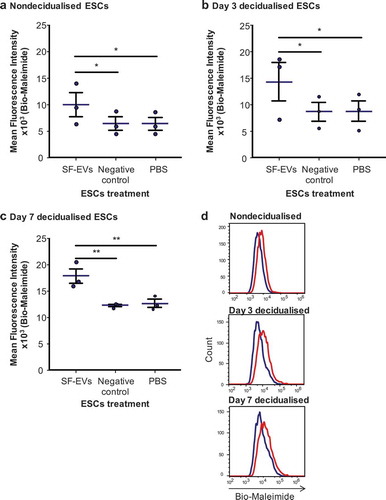
Figure 4. Binding of SF-EVs to primary ESCs: Fluorescence microscopy (a) Non-decidualised and (b) day 7 decidualised ESCs were incubated with bio-maleimide-labelled SF-EVs (5 × 10¹⁰ SF-EVs/106 cells) and fluorescence images were captured at 20× and 40× magnification; green = SF-EVs, red = β-actin, blue = nuclei. Scale bars represent 20 μm.
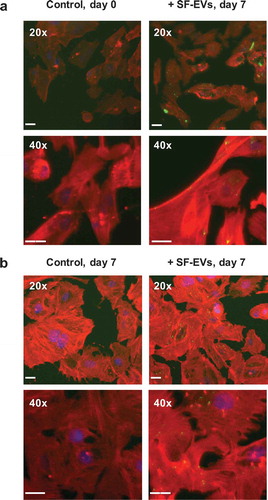
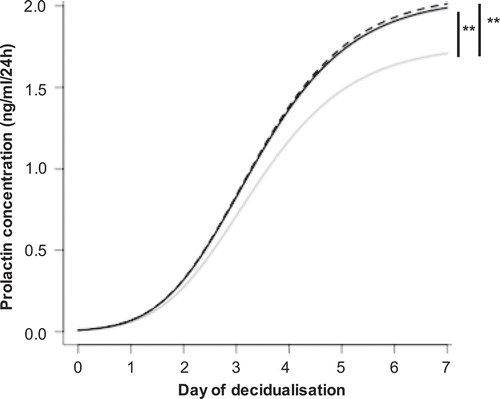
Figure 5. SF-EVs promote ESC decidualisation. Primary ESCs (n = 5) were treated with SF-EVs (5 × 10¹⁰ SF-EVs/106 cells) once (day 0 of decidualisation, solid black line) or twice (day 0 and 3 of decidualisation, dashed black line). Cells were treated with PBS in the control (solid grey line). (a) Prolactin concentration in cell supernatants at different SF-EVs exposures. p < 0.05 was considered significant. Prolactin secretion increased significantly after single (**p = 0.0044) and multiple (***p = 0.0021) SF-EV treatments throughout time.