Figures & data
Figure 1. Organic solvents cause artificial colouration. (a) Yellow colour develops when the reaction mixture contains organic solvent (e.g. DMSO). The figure shows wells containing decreasing amounts of DOPC (from the top: 16, 8, 4, 2, 1, 0.5, 0.25 and 0 µg) before addition of the phospho-vanillin reagent (after 90°C 20 min incubation). Reaction mixtures in the wells of the left column do not contain DMSO while in the right column they contain 20 µL DMSO/well. (b) Absorbance at 540 nm (arb: arbitrary units). Background of the reaction before adding phospho-vanillin reagent without DMSO is indicated as “w/o DMSO” while background with 20 µL DMSO is labelled as “w DMSO”. Scale of Y-axis was set to the axis of a standard SPV assay. Insert panel shows the curves with a zoomed Y-axis to make the linearity visible. The figure shows the result of a single representative measurement.
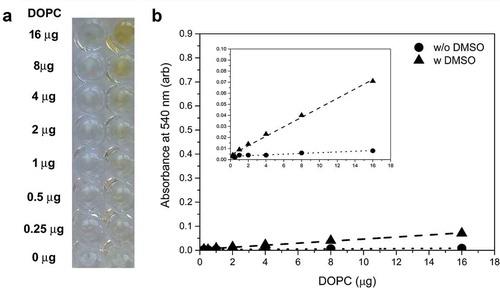
Figure 2. Standard curve of the improved lipid assay. Typical standard curve with three replicates of the optimised sulfo-phospho-vanillin lipid assay using DOPC liposome standard and optimised vanillin concentration. arb: arbitrary units, error bars refer to SD. Insert graph in the left panel highlights the standard curves between 0 and 2 µg DOPC. The right panel shows the colorimetric reaction in a 96 well plate.
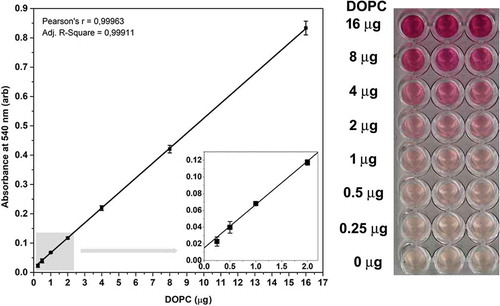
Table 1. Lipid contents of EVs isolated from two T175 confluent tissue culture flasks. EVs were isolated from 24 mL serum-free conditioned medium (24 h). Sixteen per cent of EVs (5 μL out of 30 μL was used for lipid measurements).
Figure 3. Detection of EV markers by immunoelectron microscopy using nanogold labelling. (a, b) HL-1 cell line-derived mEVs and sEVs, respectively. (c) THP-1 sEVs. (d, e) AC16 cell-derived mEVs and sEVs, respectively. (f, g) H9c2cell-derived mEVs and sEVs, respectively. Gold particles with 10 nm diameter represent CD63 (a, c, d, e, f and g) and CD81 (b). Gold particles with 5 nm diameter indicate CD81 (c, d, e, f and g). We have found that mEVs were CD81 negative and CD63 positive. In case of HL-1 cell line double labelling was not possible with the used antibodies, HL-1 mEVs were found CD63 positive while HL-1 sEVs were CD81 positive.
Table 2. Lipid contents of medium-sized EVs measured by the optimised bench top assay and by the IR-based semi-quantitative method. EVs were isolated from 24 mL serum-free conditioned medium (24 h). Mean of three technical replicates ± SD.
Figure 4. Particle size and concentration of medium-sized EVs and DOPC liposomes. Medium-sized EVs were isolated from serum-free conditioned media of H9c2 cells. DOPC liposome standard (1 mg/mL) was ten times diluted in PBS and filtered through 0.8 µm pore size membrane. Both samples were measured by qNano with NP400 membrane. (a) shows a representative bar chart of H9c2 EVs (H9c2 mEV) and liposomes (DOPC liposome), and (b) shows the DOPC liposomes and C a H9c2 mEV with transmission electronmicroscope using phosphotungstic acid contrasting.
Table 3. Protein and nucleic acid interference with the lipid assay. The presence of proteins or nucleic acids does not affect the optimised lipid assay. Bovine serum albumin (BSA) was used as a test protein and genomic DNA extracted from Saccharomyces cerevisiae cells was used as test nucleic acids. arb: arbitrary unit.
Table 4. Protein and lipid concentrations of small and medium-sized AC16 EVs. Protein concentrations of mEV and sEV vesicles were determined by Micro BCA kit (Thermo). The lipid concentration was assessed by the optimised lipid assay. EVs (mEVs AC16 and sEVs AC16) were isolated form 24 mL conditioned medium (24 h) of two confluent T175 flasks of AC16 cell culture. The tissue culture medium contained 12.5% EV-depleted serum (Gibco). mEV medium and sEV medium are technical controls of 24 mL non-conditioned medium, containing 12.5% EV-depleted serum (Gibco).
Figure 5. Correlation between the lipid and protein concentrations of EVs with the “bare surface signal” of an EPIC optical biosensor. Correlation between the EPIC “bare surface signal” and either the lipid concentration (a) or the protein concentration (b). Small EVs were isolated from serum-free conditioned medium of THP-1 cells. Data points are average of three replicates, error bars represents SD.
Figure 6. Percentage RSD of the optimised lipid assay and of a commercial lipid assay. Dashed line indicates 20% RSD which is the recommended acceptance limit for validations by ICH Quality Guidelines.
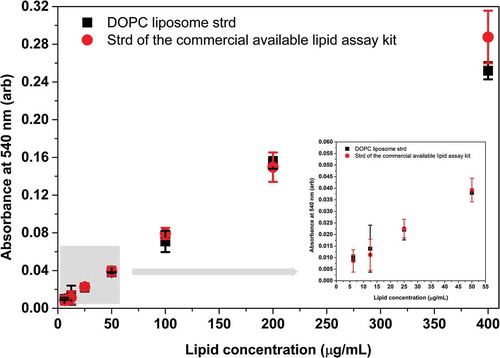
Figure 7. Comparison between the DOPC standard and the standard provided by the manufacturer of a commercial lipid kit. Both the DOPC liposome standard and the purified lipid standard of the commercial kit were measured by our optimised lipid assay. A volume of 10 µL DMSO was included in the 40 µL sample volume since the purified lipid standard was dissolved in DMSO. Reduced absorbance values were due to the presence of DMSO in the reaction mixture. Absorbance of DOPC liposome standard and standard of the commercial kit statistically do not differ at any concentration points. Insert graph highlights the results in the concentration range between 0 and 50 µg/mL. Data points represent average of three replicates, error bars shows SD. Statistics of the figure can be found in S5 Supplementary Table.