Figures & data
Figure 1. Characterization of EVs secreted from HASCs. (a) Schematic representations of EV isolation from HASCs and the EV treatment of UVB-induced skin ageing. (b) Nanoparticle tracking analysis (NTA) showing the concentration of the EVs. (c) Classic and (d) cryogenic transmission electron microscope (TEM) pictures of EVs. The scale bars represent 100 nm (white) and 20 nm (yellow). (e) Western blot analysis of EVs. Expression of EV markers (TSG101, CD9, CD63 and CD81) and internal protein markers (GM130 and Calnexin).
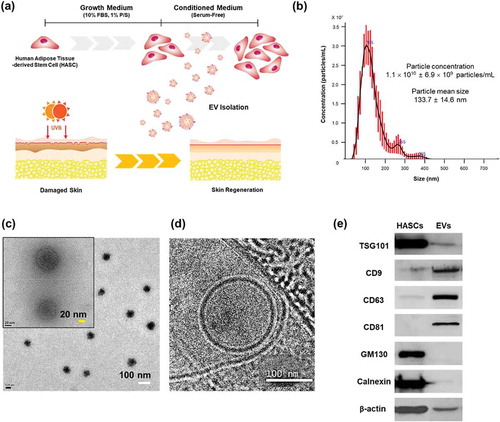
Figure 2. miRNA profiling of HASC-derived EVs. (a) Gene target analysis of miRNA profile of HASC-derived EVs. (b) Schematic representation of the predicted target genes and corresponding cellular functions of the miRNAs enriched in EVs.
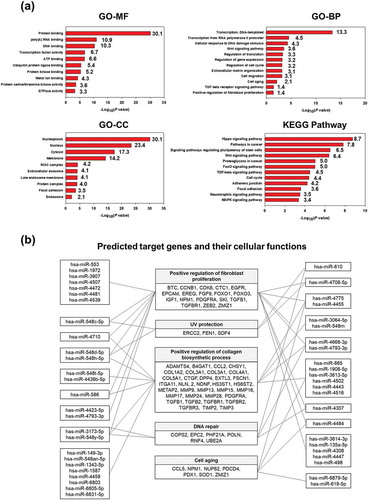
Figure 3. Proteomic analysis and cytokine arrays of HASC-derived EVs. (a) Pie chart depicting the functional classification of the proteins differentially expressed in EVs. EV proteins were categorized by molecular function and biological process using GO analysis in DAVID Bioinformatics Resources, version 6.8. (b) Representative fluorescent images of the cytokine arrays. Cytokines were arrayed on a glass chip containing 80 different cytokine antibodies and detected with a laser scanner using the Cy3 channel. Quantitation of the signals was performed via image analysis. The signal intensity was normalized to the positive control and expressed as fold change. The mean relative intensities and standard deviations are based on two different experiments. Abbreviations: IGF-1, insulin-like growth factor-1; IGFBP, insulin-like growth factor-binding protein; IL, interleukin; MCP-1, monocyte chemotactic protein 1; PDGF-BB, platelet-derived growth factor-BB; TGF-β1, transforming growth factor-beta1; TIMP, tissue inhibitor of metalloproteinase; TNF, tumour necrosis factor; VEGF, vascular endothelial growth factor.
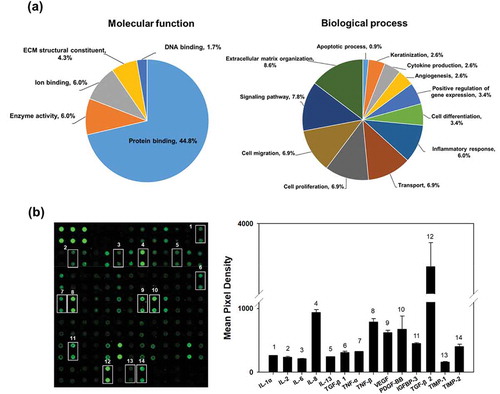
Figure 4. The cellular uptake of HASC-derived EVs in normal and UVB-irradiated HDFs. Light differential interference contrast (DIC) and corresponding confocal images of HDFs after 3 h incubation with 1 × 10⁸ particles/mL of PKH67-labelled EVs, respectively (n = 3). Images of PKH67-labelled EVs (green) with DAPI (blue) were visualized by merging the confocal images (Merge1) or bright-field with confocal images (Merge2). Scale bars represent 25 μm.
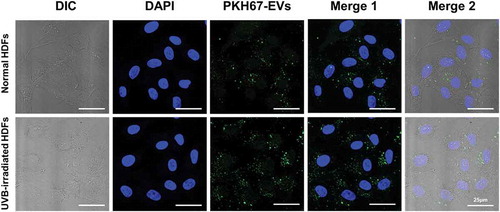
Figure 5. The effects of HASC-derived EVs on the wound recovery of UVB-irradiated HDFs. HDFs were seeded in 24-well plates at 1 × 10⁵ cells per well and maintained in growth medium until they reached 90% confluence. The HDFs were then exposed to UVB radiation at a dose of 0.05 J/cm2 once a day for 3 days. The normal and UVB-irradiated HDFs were scratch-wounded with a sterilized micropipette tip and incubated in growth medium (GM), serum-free medium (SFM), BSA 0.1% and EVs (1 × 10⁸ particles/mL) containing SFM for 24 h. (a, b) Light microscopic images of HDFs in the scratched area. The yellow dotted lines indicate the original wound edge in the scratch array. Scale bars represent 200 μm. (c) Wound recovery rates of HDFs into the scratched area. The wound recovery rate is presented as the percentage of scratch closure. The data are shown as the means ± standard deviations (n = 5).
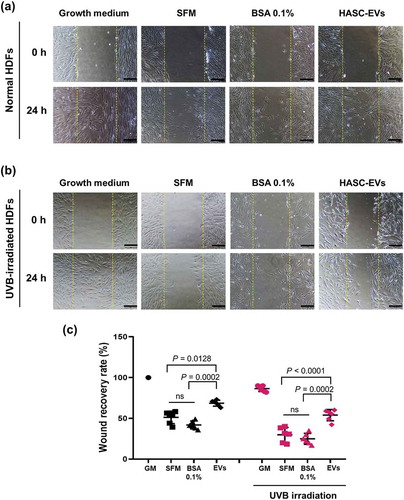
Figure 6. The effects of HASC-derived EVs on the (a) migration and (b) proliferation of UVB-irradiated HDFs. HDFs were exposed to UVB radiation at a dose of 0.05 J/cm2 once a day for 3 days. (a) The normal and UVB-irradiated HDFs were seeded into the upper side of the transwell membrane and maintained in growth medium (GM), serum-free medium (SFM), BSA 0.1% and EVs (1 × 10⁸ particles/mL) containing SFM for 24 h. Migrated cells to the lower side were fixed with 4% paraformaldehyde and stained with crystal violet. Scale bars represent 100 μm. (b) The normal and UVB-irradiated HDFs were seeded in 24-well plates and maintained in growth medium (GM), serum-free medium (SFM), BSA 0.1% and EVs (1 × 10⁸ particles/mL) containing SFM for 48 h. The proliferation of HDFs was determined by CCK-8 assay. The data are shown as the means ± standard deviations (n = 4) with significance at *p < 0.01.
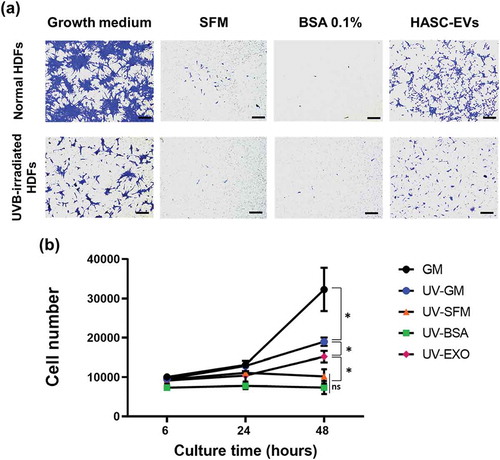
Figure 7. Gene expression in HDFs with or without HASC-derived EVs treatment after UV irradiation. The gene expression was determined using quantitative PCR. Relative gene expression was normalized to a housekeeping gene (GAPDH) and expressed as the fold change compared to normal HDFs. The data are shown as the means ± standard deviations (n ≥ 5). Abbreviations: COL1A1, type I collagen alpha 1; COL2A1, type II collagen alpha 1; COL3A1, type 3 collagen alpha 1; COL4A2, type IV collagen alpha 1; COL5A1, type V collagen alpha 1; ELN, elastin; MMP, matrix metalloproteinase; TIMP, tissue inhibitor of metalloproteinase; TGFB1, transforming growth factor-β1.
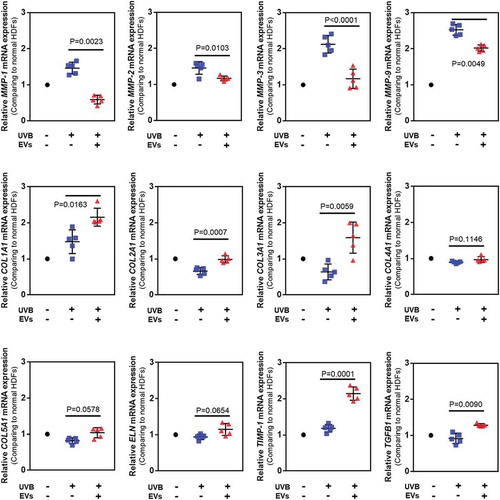
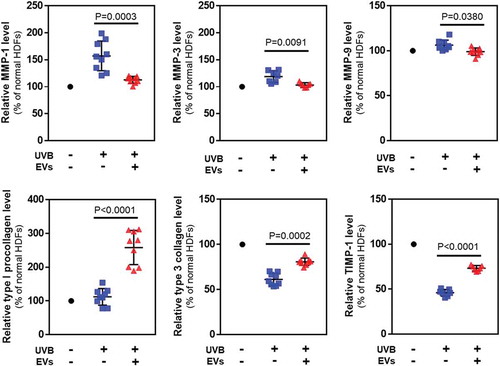
Figure 8. Protein levels in HDFs with or without HASC-derived EVs treatment after UV irradiation. The expression of proteins associated with dermal matrix synthesis and degradation was determined using ELISA. The values were normalized to total protein concentration. The data are shown as the means ± standard deviations (n ≥ 5).