3,053
Views
60
CrossRef citations to date
0
Altmetric
Research Article

An experimental strategy unveiling exosomal microRNAs 486-5p, 181a-5p and 30d-5p from hypoxic tumour cells as circulating indicators of high-risk rectal cancer

ORCID Icon, , , , , , & ORCID Icon show all
Article: 1567219 | Received 19 Apr 2018, Accepted 05 Jan 2019, Published online: 29 Jan 2019

Figures & data

Figure 1. Characteristics of normoxic and hypoxic exosomes released by HCT116 cells. Cells were incubated in medium supplemented with BSA under normoxia or hypoxia for 24 h, and whole cell lysates and extracellular vesicles (EVs) isolated by ultracentrifugation were characterised. For each set of experiments, three biological set-ups were done. (a) Immunoblot images of hypoxia-inducible factor type-1α (HIF1α), carbonic anhydrase IX (CAIX), CD9, CD63, CD81, Alix, Calnexin, GRP78 and GM130 expression. CoCl2 (100 μM for 4 h in normoxia) was positive control for cellular HIF1α expression; culture medium containing 1% BSA was negative control for EVs. 10 μg proteins were loaded in each gel lane. (b) Cryo-electron microscopy images (50,000 × , 80,000 × and 100,000 × magnifications) of EVs. The positions of the zoomed-in panels within the wide-field views are indicated by arrows; scale bars are 100 nm. The lower panels are independent representative high-magnification images; scale bars are 75 nm. (c) NanoSight tracking histograms of EVs. Mean values from three biological set-ups are shown. (d) Flow-cytometry histograms of EVs stained with Phycoerythrin (PE)-labelled exosome-enriched markers (open traces) or isotype control (filled traces).
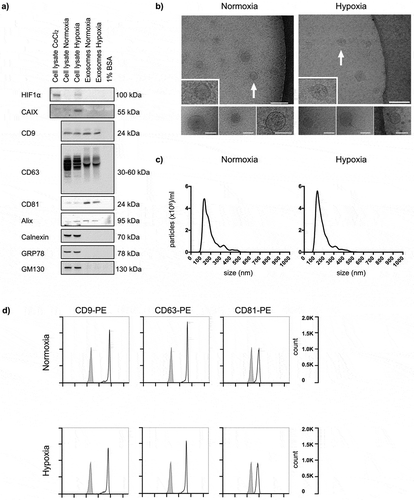
Figure 1. Characteristics of normoxic and hypoxic exosomes released by HCT116 cells. Cells were incubated in medium supplemented with BSA under normoxia or hypoxia for 24 h, and whole cell lysates and extracellular vesicles (EVs) isolated by ultracentrifugation were characterised. For each set of experiments, three biological set-ups were done. (a) Immunoblot images of hypoxia-inducible factor type-1α (HIF1α), carbonic anhydrase IX (CAIX), CD9, CD63, CD81, Alix, Calnexin, GRP78 and GM130 expression. CoCl2 (100 μM for 4 h in normoxia) was positive control for cellular HIF1α expression; culture medium containing 1% BSA was negative control for EVs. 10 μg proteins were loaded in each gel lane. (b) Cryo-electron microscopy images (50,000 × , 80,000 × and 100,000 × magnifications) of EVs. The positions of the zoomed-in panels within the wide-field views are indicated by arrows; scale bars are 100 nm. The lower panels are independent representative high-magnification images; scale bars are 75 nm. (c) NanoSight tracking histograms of EVs. Mean values from three biological set-ups are shown. (d) Flow-cytometry histograms of EVs stained with Phycoerythrin (PE)-labelled exosome-enriched markers (open traces) or isotype control (filled traces).

Table 1. Exosomal microRNAs with significantly different expression by cell lines under hypoxia compared to normoxia.

Figure 2. Characteristics of circulating exosomes from patients with locally advanced rectal cancer (LARC). Extracellular vesicles (EVs) precipitated from three patients’ plasma samples by the miRCURY™ Exosome Isolation Kit (Exiqon Services) were characterised. (a) Cryo-electron microscopy images (50,000 × and 60,000 × magnifications) of EVs. The dark grey structures are ice crystal contaminations (in LARC 1 and LARC 3). The positions of the zoomed-in panels within the wide-field views are indicated by arrows; scale bars are 100 nm. (b) NanoSight tracking histogram of EVs. (c) Immunoblot images of CD9, CD63, Alix and GM130 expression. Whole cell lysates and exosomes isolated by ultracentrifugation from the HCT116 cell line were controls. 150 μg proteins from the EV plasma samples and 10 μg proteins from the cell line samples were loaded on the gel.
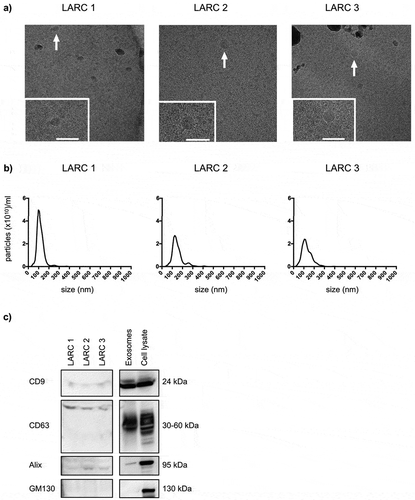
Figure 2. Characteristics of circulating exosomes from patients with locally advanced rectal cancer (LARC). Extracellular vesicles (EVs) precipitated from three patients’ plasma samples by the miRCURY™ Exosome Isolation Kit (Exiqon Services) were characterised. (a) Cryo-electron microscopy images (50,000 × and 60,000 × magnifications) of EVs. The dark grey structures are ice crystal contaminations (in LARC 1 and LARC 3). The positions of the zoomed-in panels within the wide-field views are indicated by arrows; scale bars are 100 nm. (b) NanoSight tracking histogram of EVs. (c) Immunoblot images of CD9, CD63, Alix and GM130 expression. Whole cell lysates and exosomes isolated by ultracentrifugation from the HCT116 cell line were controls. 150 μg proteins from the EV plasma samples and 10 μg proteins from the cell line samples were loaded on the gel.

Table 2. Exosomal microRNAs in patients’ plasma and correlations with disease factors.

Supplemental material

Supplemental Material

Download MS Word (5 MB)