Figures & data
Figure 1. Characterisation of EV samples obtained with 1x UC, 2x UC and SEC protocols. a: Representative size distribution obtained using NTA on HLSC and MSC EV samples obtained with 1x UC, 2x UC and SEC protocols. b: Representative transmission electron microscopy (TEM) pictures of HLSC and MSC EVs obtained with all three isolation protocols. Scale bars represent 100 nm. c: Western blots of cell and EV lysates from HLSCs and MSCs. For cell lysates, 10 µg (HLSCs) and 5 µg (MSCs) of protein was loaded. EV lanes contained 2E10 particles (HLSCs) or 0.8E10 particles (MSCs). d: EV purity expressed as the ratio of particles and µg of protein, calculated by NTA and colorimetric microBCA protein assay respectively. e: Aggregation index (AI) of each sample obtained after the nanoplasmonic assay and normalised for the protein concentration as calculated by micro BCA protein assay. * indicates p < 0.05, ** p < 0.01 after one-way ANOVA with Tukey post-hoc test.
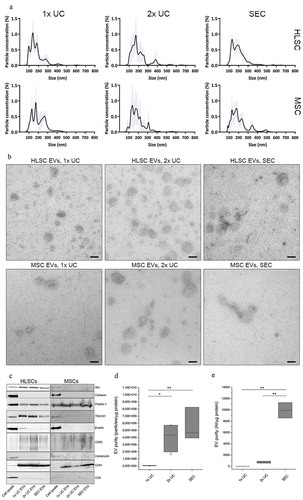
Figure 2. Raman spectra of EV samples and reference molecules. a-b: Mean Raman spectra obtained on air-dried drop of EV samples isolated by 1x UC, 2x UC and SEC protocols from HLSC (a) and MSC (b) supernatants. All spectra were baseline corrected, aligned and normalised before averaging. c: Representative Raman spectra of reference molecules: cholesterol (Chol), sphingomyelin (SM), phosphatidylcholine (PC), SNAP 25 recombinant protein and single stranded RNA. All spectra were obtained with 532 nm laser line and 30 s of exposure for 2 accumulations.
Figure 3. Multivariate statistical analysis of Raman spectra. PCA-LDA analysis performed on all spectra obtained on EV and non-EV samples from HLSC and MSC (n ≥ 25 per sample). a,b: Scatter plots representing the values obtained for the Canonical Variable 1 and Canonical Variable 2 after LDA. In the classification model shown in (a), spectra from EVs were grouped based on their isolation method and non-EV spectra were analysed as an internal control. In (b), spectra were grouped based on both isolation method and cell source. In both analyses, the first 20 PC scores calculated by means of PCA were used for the LDA. Each dot represents a single spectrum. c,d: Box plots representing the Canonical Variable 1 obtained for every considered group of samples after the corresponding LDA analysis. In (c), the ability of RS to distinguish between EV and non-EV samples and between EV samples isolated by means of different protocols was verified. In (d), the Canonical Variable 1 was considered to evaluate the ability of RS to distinguish between HLSC- and MSC-derived EVs, isolated by different procedures. * indicates p < 0.05, ** p < 0.01, *** p < 0.001 after one-way ANOVA with Tukey post-hoc test.
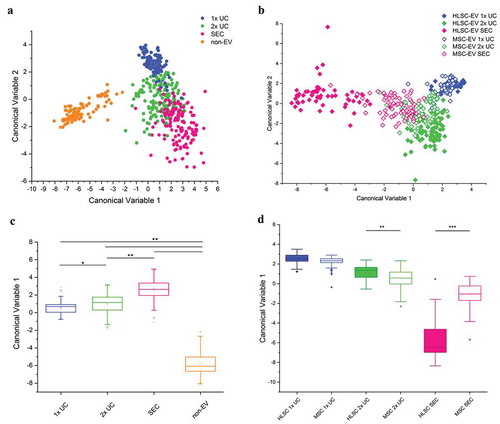
Figure 4. Spectroscopic protein-to-lipid and nucleic acid-to-lipid ratios. Box plots showing the spectroscopic protein-to-lipid ratio (P/L) in (a) and nucleic acid-to-lipid ratio (NA/L) in (b). Differences in the P/L and NA/L values obtained for HLSC- and MSC-derived EVs isolated by different methods were compared. ** indicates p < 0.01, *** p < 0.001 after one-way ANOVA with Tukey post-hoc test.
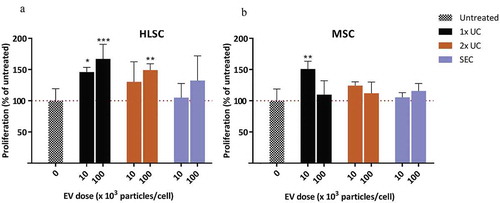
Figure 5. Proliferation assay. Effect of HLSC (a) and MSC (b) derived EVs at doses of 10E4 or 10E5 particles/cell on HK-2 cells cultured under serum-free conditions. After 72 h, proliferation was determined using a BrdU cell proliferation ELISA. Proliferation of treated samples was expressed as a percentage of the proliferation of untreated cells. * indicates p < 0.05, ** p < 0.01, *** p < 0.001 after one-way ANOVA with Dunnett’s post hoc test.