Figures & data
Figure 1. Representation of the first two dimensions of the principal component analysis (PCA) for the 302 metabolites, expressed as percentage of total composition for MLP29 cells (CM) and EVs (EM) and RH cell (CR) and EVs (ER). The dots named Type represent an average of the four samples (biological replicates) included in the study (1 for CM, 2 for CR, 3 for EM and 4 for ER).
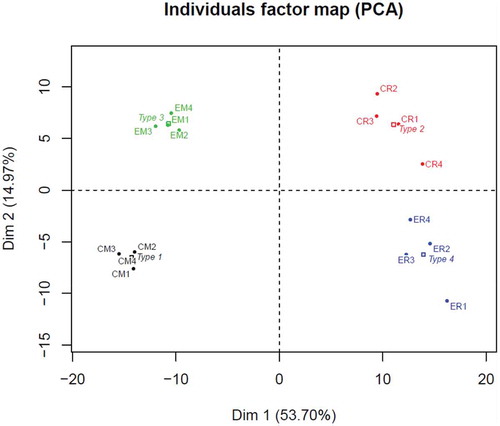
Figure 2. Correlation matrix analysis for the amino acid group and each lipid families; values are correlation coefficient and only significant values (p < 0.05) are coloured. The colour gradient is in accordance with the correlation coefficient value. Each of the presented correlations was calculated among all the species belonging to that family. The numerical value used for each species is the average of four samples (biological replicates). Within each family, a correlation matrix was generated between the four group of samples existing; EVs from MLP29 (EV_MLP), cells from MLP29 (C_MLP), EVs from RH (EV_RH) and cells from RH (C_RH).
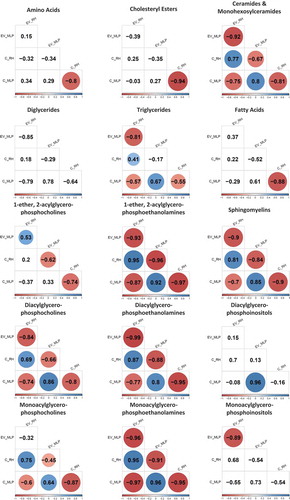
Figure 3. Comparison between the percentage composition of EVs from RH and MLP29. For each group the bar represents the average of the percentage for each family of lipids respect to the total signal of lipids, and the error bar represents SEM (n = 4, biological replicates). T-test was assayed between both groups for each family of lipids, and significance is represented as * for those comparisons with p < 0.05 after correction for multiple comparison. The symbol # represents a p > 0.05 after correction for multiple comparison, but < 0.05 without that correction. Black bars correspond to RH and grey bars correspond to MLP29.
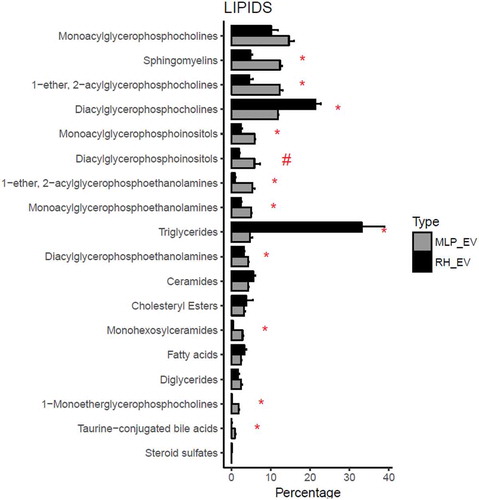
Figure 4. Metabolites impoverished or enriched in EVs common to MLP29 and RH. The bar represents the log2 of the ratio between the mean of the percentages for EVs and the mean of the percentages for their parental cells. Error bar represents the 95% confidence interval calculated as 1.96*SE, while the line at 0 represents neither enrichment nor impoverishment. Therefore, values to the left represent impoverishment in EVs while values to the right represents enrichment in EVs. Only those species whose percentages have a statistically significant difference between cells and EVs for both types of cells are presented in this graph. PC(O-18:1/12:4) and 18:2n-x were undetected in RH_EVs and a arbitrary value has been given to draw the graph. Dark grey bars represent RH and light grey MLP29.
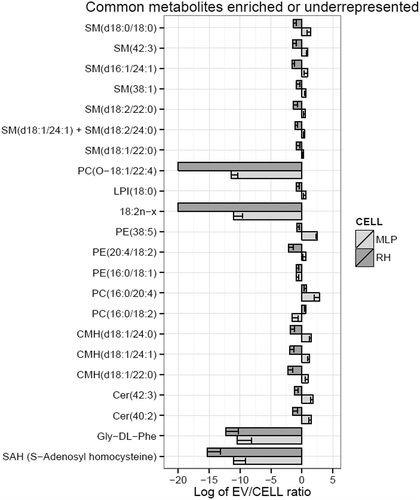
Figure 5. Comparison between the percentage composition of cells for RH and MLP29. For each group the bar represents the average of the percentage for each family of lipids respect to the total signal of lipids, and the error bar represents SEM (n = 4, biological replicates). T-test was assayed between both groups for each family of lipids, and significance is represented as * for those comparisons with p < 0.05 after correction for multiple comparison. The symbol # represents a p > 0.05 after correction for multiple comparison, but < 0.05 without that correction. Black bars correspond to RH and grey bars correspond to MLP29.
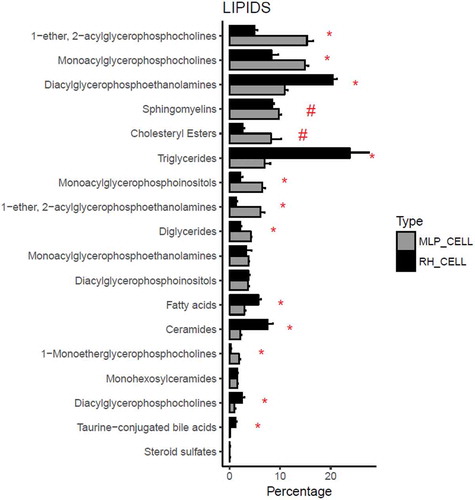
Figure 6. Families of lipids impoverished or enriched in EVs. The bar represents the log2 of the ratio between the mean of the percentages for EVs and the mean of the percentages for their parental cells (n = 4, biological replicates). Error bar represents the 95% confidence interval calculated as 1.96*SE, while the line at 0 represents neither enrichment nor impoverishment. Therefore, values to the left represent impoverishment in EVs while values to the right represents enrichment in EVs. T-test was assayed between the percentage of each family in EVs or in cells, and significance is represented as * for those comparisons with p < 0.05 after correction for multiple comparison. The symbol # represents a p > 0.05 after correction for multiple comparison, but < 0.05 without that correction. Graph a corresponds to MLP29 and graph b corresponds to RH.
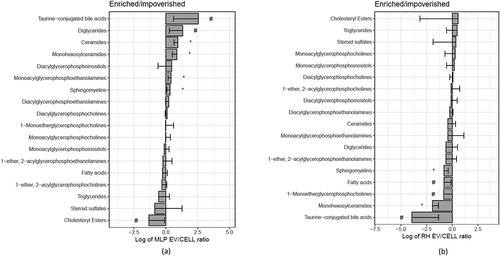
Figure 7. Comparison between the percentage composition of EVs from RH and MLP29. For each group the bar represents the average of the percentage for each amino acid respect to the total signal of amino acids, and the error bar represent SEM (n = 4, biological replicates). T-test was assayed between both groups for each amino acid, and significance is represented as * for those comparisons with p < 0.05 after correction for multiple comparison. The symbol # represents a p > 0.05 after correction for multiple comparison, but < 0.05 without that correction. Black bars correspond to RH and grey bars correspond to MLP29.
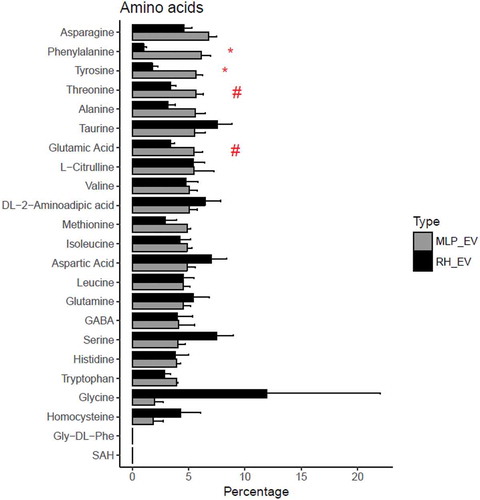
Table 1. Elastic constant k (N/m), breaking force (pN) and indentation at which EV ruptures (critical deformation (nm)), mean ± SD. n indicates the number of particles measured. Highlighted in grey, those parameters which are statistically significant different, with a value of p < 0.001.
Figure 8. High resolution AFM topography of one MLP29 EV in buffer conditions; (a) 3D surface reconstruction of this MLP29 EV particle. (b) 2D topographic image (500 × 500 nm scan size, 256 × 256 pixels) of the same particle, indicating the line where the cross-sectional height profile (c) was calculated from the force map. The profile along the top of the EVs was determined by averaging the height of a five-pixel radius of influence. The height of the particle was considered as the maximum value obtained in this topographical profile.
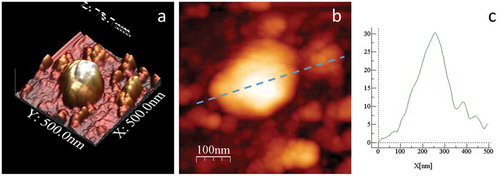
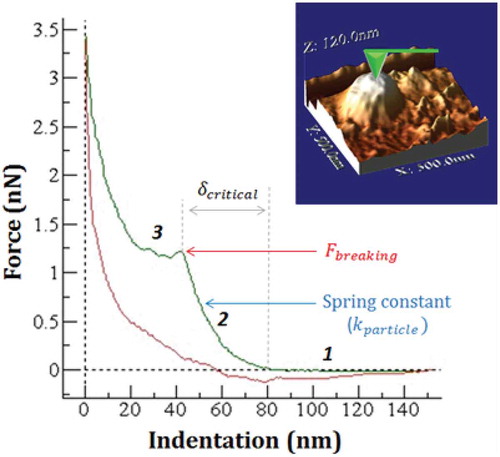
Figure 9. Single force-indentation curve (FIC) on top of a MLP29 EV seen on top of the image. It was obtained by subtracting the contribution of the cantilever from the curve FZ performed on the particle. This nanoindentation curve shows the evolution of the force along the z-piezo elongation, exhibiting three main stages: before contact (1), during elastic deformation (2) and after breaking (3). Mechanical parameters such as the critical indentation, breaking force or elastic constant can be obtained from this indentation curve.