
Figures & data
Figure 1. Characterization of the primary NOF and CAF cell cultures. The relative expression of α-SMA was higher in CAF when compared to NOF cells, as revealed by both western blot (a), which can be graphically visualized by the densitometry analysis relative to β-actin expression, and by qRT-PCR (b). (c) Representative images of CAF and NOF immunofluorescence assay revealed the stressed actin fibres typical of CAF. (d) The senescence of these cells was accessed by the expression of β-galactosidase activity, and the bars represent the percentage of positive cells. The senescence rate was of approximately 20% maximum for all cell cultures.
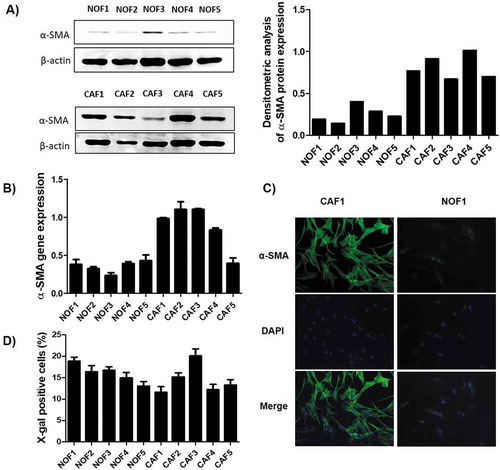
Figure 2. CAF-EV induce invasion of OSCC cells. (a) CAF-EV from each of the five cell lines were individually able to induce significantly the invasion of the tumour cells (HSC-3, SAS, SCC-15) in the myogel-coated transwell when compared to NOF-EV and to the control without vesicles. (b) Representative images of the invaded HSC-3 cells. (c) Pooled CAF-EV were also able to induce a higher invasion rate of HSC-3 cells. *p ≤ 0.05, **p ≤ 0.01, ***p ≤ 0.001.
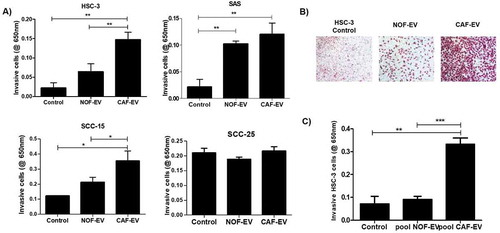
Figure 3. CAF-EV promote a budding pattern of invasion. Pooled NOF- or CAF-EV were cultured with HSC-3 cells and let to invade within the 3D-myoma organotypic model for 14 days. (a) Representative images of the invaded cells stained with pan-cytokeratin (scale bars represent 400 µm). (b) Quantification of the invaded cells. CAF-EV induced HSC-3 cells to invade deeper and in smaller tumour cell islands compared to the NOF-EV treated and to the control cells (HSC-3 cells without EV). *p ≤ 0.05, **p ≤ 0.01, ***p ≤ 0.001.
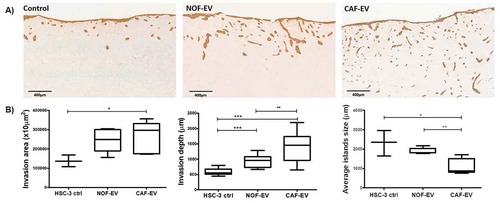
Figure 4. Effect of CAF-EV on migration, proliferation, and apoptosis of HSC-3 cells. (a) Pooled NOF-and CAF-EV were added to the scratched wounds of HSC-3 cells. HSC-3 cells migrated faster when cultured with CAF-EV at 6 h, 12 h and 24 h (p < 0.05) compared to NOF-EV. Pictures represent the initial (0 h) and final (24 h) views of the wounded areas, delimitated by a white line. The graph on the left panel shows the decrease of wound area in percentages when the area at 0 h was set to be 100%. The EV treatment did not affect the proliferation at 24 h (b), but the apoptosis rate at 24 h was significantly higher in HSC-3 cells treated with CAF-EV compared to the control (c), showed as a percentage of apoptotic cells, as resulted from an annexin-V based apoptosis assay. (d) To confirm the results, a TUNEL assay was also performed in EV-treated HSC-3 cells, resulting in similar findings. *p ≤ 0.05.
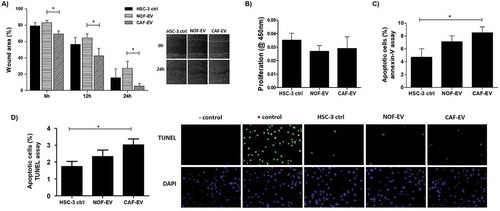
Figure 5. Proteome of constitutive EV released from Fibroblasts. (a) Venn diagram of the numerical values for common and unique proteins present in CAF (violet) and NOF (grey). (b) Analysis of cellular component GO terms. The proteins detected in both CAF and NOF fractions (total 50 constitutive EV proteins) were grouped using GO terms related to cellular component analysis process using DAVID [Citation56]. (c) Analysis of molecular function GO terms of total EV proteins of both groups. (d, e) EV proteins were grouped in CAF (D) or NOF (E) using (GO) terms related to biological process analysis using DAVID (p < 0.05) and shown in Supplementary Table 7. The graph shows the percentage of proteins identified by mass spectrometry that fall into designated GO category relative to the total number of proteins in the category. GO FAT was used to minimize the redundancy of general GO terms in the analysis. Categories with enrichment greater than 6% are shown.
![Figure 5. Proteome of constitutive EV released from Fibroblasts. (a) Venn diagram of the numerical values for common and unique proteins present in CAF (violet) and NOF (grey). (b) Analysis of cellular component GO terms. The proteins detected in both CAF and NOF fractions (total 50 constitutive EV proteins) were grouped using GO terms related to cellular component analysis process using DAVID [Citation56]. (c) Analysis of molecular function GO terms of total EV proteins of both groups. (d, e) EV proteins were grouped in CAF (D) or NOF (E) using (GO) terms related to biological process analysis using DAVID (p < 0.05) and shown in Supplementary Table 7. The graph shows the percentage of proteins identified by mass spectrometry that fall into designated GO category relative to the total number of proteins in the category. GO FAT was used to minimize the redundancy of general GO terms in the analysis. Categories with enrichment greater than 6% are shown.](/cms/asset/2679c638-3c6c-47c9-8a31-93a64c96c270/zjev_a_1578525_f0005_oc.jpg)