Figures & data
Figure 1. (a) Appearance of LPMB in antigenically stimulated RBL2H3. Confocal images of RBL2H3 stimulated with IgE/DNP-BSA for 15 min at 37°C. A series of 64 z discs were assembled and projected in NIS elements and z-depth coded using a 20.2 micron pseudo-coloured look-up table prior to deconvolution. Scale bar 10 microns. (b) Lucifer Yellow staining of LPMB indicating contiguousness with cytosol. Epifluorescence images of RBL2H3 stimulated with IgE/DNP-BSA for 15 min at 37°C after 20 min pre-incubation with 10 nM Lucifer Yellow. Scale bar 10 microns. (c) LPMB content presents differently in degranulating and non-degranulating RBL2H3. Left panels. Two LPMB from non-degranulating cells stimulated with ionomycin (500 nM for 15 min at 37°C), which causes intracellular calcium flux but is insufficient to initiate degranulation. Arrow indicates large LPMB with no visible content under phase-contrast imaging. Right panels. Two LPMB from degranulating RBL2H3 stimulated via FcεRI (IgE anti-DNP and KLH-DNP). Arrow indicates vesicular content apparent within the LPMB boundaries. Scale bars 2 microns. (d) WGA-positive vesicular structures appear in LPMB in degranulating cells. RBL2H3 were incubated with Alexa 488-WGA for 6 h to provide staining of intracellular membranes. Phase-contrast images (left) and confocal z discs (right) were captured at the indicated time points after stimulation via FcεRI. Arrows indicate vesicular content apparent within the LPMB boundaries. Scale bar 2 microns. (e) Dependency of LPMB formation upon external calcium. RBL2H3 were stimulated for 8 min at 37°C in modified Ringer’s solution containing either 1 mM external CaCl2 or formulated as nominally calcium free (0 mM external CaCl2 plus1mM EGTA). Stimuli were IgE anti-DNP and KLH-DNP, ionomycin (500 nM) or thapsigargin (250 nM). Alexa 488-WGA was included in the media throughout the experiment and cells were live-cell imaged after one brief wash to remove excess dye. LPMB per 100 cells (triplicate fields of approximately 33 cells) were counted and expressed as a histogram.
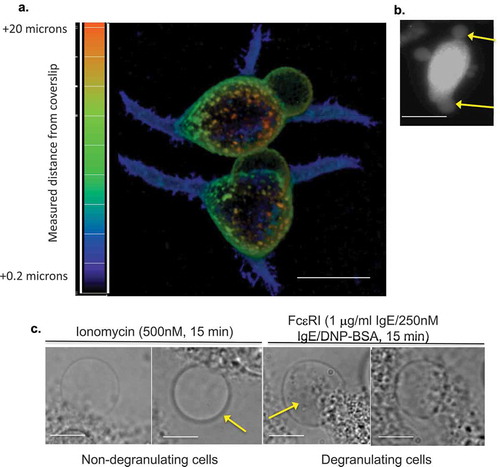
Figure 1. (Continued).
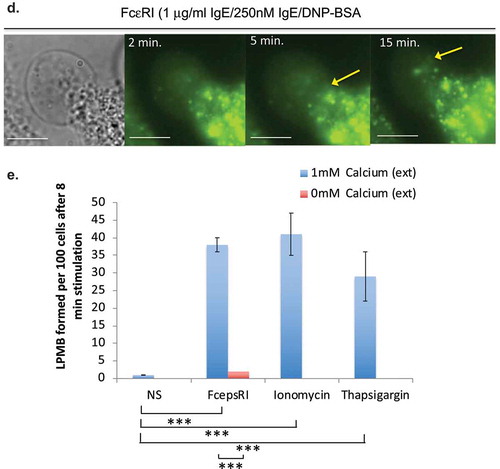
Table I. Frequency and magnitude of LPMB formation in primary mast cells, primary basophils and a model basophilic cell line. Bone marrow-derived murine mast cells, peripheral blood-derived human basophils and the rat basophilic leukemia cell line RBL2H3 were exposed to either IgE anti-DNP or IgE anti-DNP followed by DNP-BSA to antigenically-crosslink FcεRI receptors. Triplicate fields of 100 cells live-cell stained with Alexa 568-wheatgerm agglutinin were assessed for the formation of LPMB (a protrusion stably forming on the plasma membrane of diameter that is 7.5% or more of the cell diameter at longest axis by 5 min after stimulation). Numbers of cells exhibiting LPMB were scored, and the mean size of LPMB as a percentage of the cell diameter on the longest axis was calculated.
Table II. Summary of measured rates and lag times (time to onset) of LPMB formation in response to FcεRI stimulation of RBL2H3 across 408 measured LPMB (100 cells per day, 3 replicate days).
Figure 2. Formation dynamics of LPMB. (a) Formation kinetics of a LPMB in a representative cell. Cells were stimulated via FcεRI and live-cell stained with Alexa 488-WGA. Live-cell confocal time series of an evolving LPMB were captured for a single z disc. Each white line represents the size of the LPMB at 15 s intervals. Scale bar 2 microns. (b) Example formation kinetics of LPMB from four cells. Four LPMB were measured over a 15 min period in FcεRI-stimulated and live-cell Alexa 488-WGA-stained RBL2H3. Live-cell confocal time series of an evolving LPMB was captured for a single z disc. LPMB size over time was normalized as a percentage of their final attained area. Each colour represents a different LPMB, and diversity in lag time, and similar formation kinetics and occasional deflation of the LPMB are observed. . Statistical analysis of LPMB formation. (c) Formation angles of LPMB. Example LPMB from RBL2H3 stimulated for 8 min via FcεRI and live-cell stained with Alexa 488-WGA. Two angles were selected for measurement (a and b). (d) Acute formation angle b measurements over time. Measurements were taken at indicated intervals, with 0 min being the earliest visible onset of GMPV formation. Each line represents a LPMB from a different cell. Data points at the times indicated by asterisks (*) were tested for significant difference by a Student’s t test and no significant variation was found (p > 0.05).
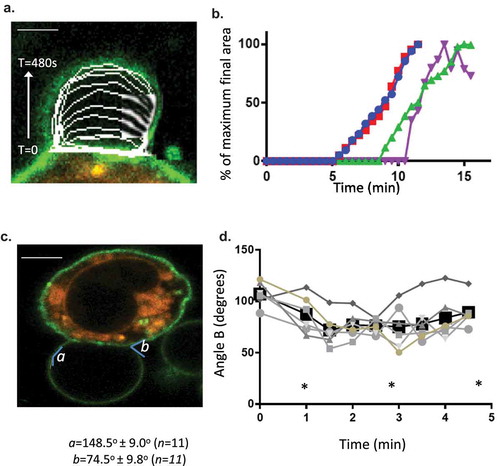
Figure 3. (a) LPMB formation model. This model suggests a relationship between calcium-induced exofacial relocation of PM PS, localized dissociation of the actin cytoskeleton and hydrostatic pressure (Pa)-induced inflation of LPMB in areas of membrane where Pa is not opposed by the stiffness of the cortical actin. (b) Cortical actin disruption at LPMB formation site. RBL2H3 were live-cell stained with Alex488-WGA and lysotracker (included to visualize intracellular vesicular structures including secretory granules) (i-iii) or Alexa-488 Phallioidin (iv, v, vi, vii) and stimulated with IgE/DNP-BSA for 15 min at 37°C. I, ii, iii, vi, vii. Localized Alexa-488 WGA staining and intensity profiles in areas of LPMB formation at 0 (i) and 15 (ii, iii) min after stimulation. (iv, v). Alexa-488 phalloidin (iv) and bright-field (v) imaging of a LPMB 15 min after stimulation, showing disruption of cortical actin cytoskeleton in septal area. Scale bar 10 microns. (vi). Single z disc from example Alexa-488 Phallioidin-stained cell showing perforated actin cytoskeleton at LPMB formation site. (vii) Assembled z stack (24 z discs) of cell stained in (vi). Scale bars 5 microns. (c) z-depth coded 3D reconstructed projection of cortical actin staining in LPMB-positive area of activated mast cell as shown in (iv) and (v). A series of 64 z discs were assembled and projected in NIS elements and z depth coded using a 20.2 micron pseudo-coloured look-up table prior to deconvolution. (d) Exofacial relocation of plasma membrane phosphatidylserine (PS). Example confocal images of RBL2H3 stimulated with PMA and ionomycin (500 nM each) for 15 min at 37°C. Cells were pre-incubated with 4 µM Fluo-4 and the imaging bath contained 1 µM alexa-568 Annexin V. Individual z planes at 0 (left panel) and 15 min (right panel) are shown. (e) Relationship between calcium flux and exofacial PS relocation in activated RBL2H3. Cells were pre-incubated with 4 µM Fluo-4 and the imaging bath contained 1 µM Alexa-568 Annexin V. Representative ROI of whole cytosol or PM were analysed for Fluo-4 and Alexa-538 Annexin V-staining intensity over time in response to PMA/ionomycin stimulation. Left panel. Florescence intensity of Fluo-4 (measured in a whole-cytosol ROI) and Alexa 568-Annexin V (measured in a membrane located ROI) over time. Right panel. Confocal image of RBL2H3 stimulated with PMA and ionomycin (500 nM each) for 15 min at 37°C. Individual z plane at 5 min is shown.
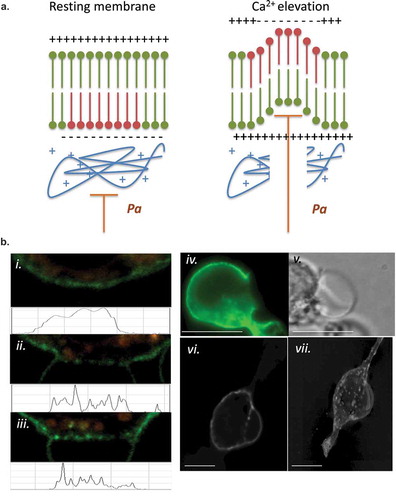
Figure 3. (Continued).
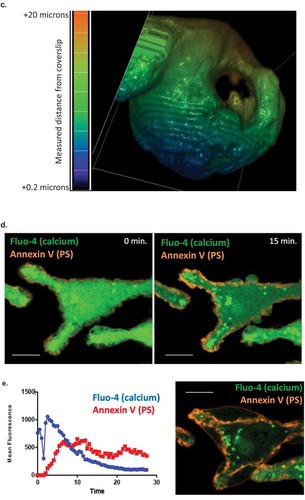
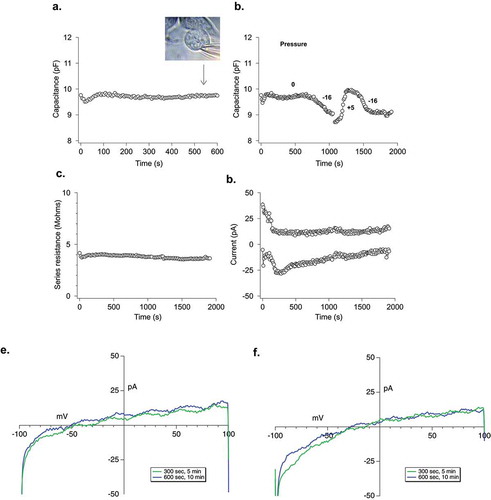
Figure 4. Electrophysiological analysis of LPMB. (a) Cellular capacitance during LPMB formation. Capacitance recording under whole-cell patch clamp of RBL2H3 cell where stimulation was mimicked by 1.2 µM buffered calcium in the internal solution. LPMB formation started after ~80 s. Bright-field image of the LPMB showing the position of patch pipette at 540 s timepoint is shown in inset. LPMB is displayed at 540 s. The capacitance recording was taken every 2 s for the duration of the recording. (b) Effect of mimicking altered hydrostatic pressure on membrane capacitance. An extended recording of capacitance in the RBL2H3 cell that showed LPMB formation. Positive and negative pressure was applied to the pipette to shrink and expand the cell with internal pressure, showing that while LPMB formation did not cause a change in capacitance, this change could be elicited form the same cell artificially. The capacitance recording was taken every 2 s for the duration of the recording. (c) Series resistance during LPMB formation. Series resistance recording spanning 2000 s, taken every 2 s of an RBL2H3 cell that showed LPMB formation. The series resistance recording was performed on the same RBL2H3 cell that was used in . (d) Absence of inward and outward currents throughout the LPMB formation period. Current recording in pA spanning 2000 s of an RBL-2H3 cell that showed LPMB formation. The current was generated with a ramp pulse from −100 mV to +100 mV with the current extract at −80 mV and + 80 mV. The ramp was pulsed every 2 s for the 2000 s duration. (e) Representative current voltage relationship displayed at 300 s and 600 s into recording during LPMB formation. Each of the graphs represents a single cell with two traces (green and blue which represents 300 s and 600 s, respectively) extracted and displayed to show the current voltage relationship of the cell during LPMB formation.