Figures & data
Figure 1. Expression of cytotoxic proteins from different batches of NK-EV isolates.
NK-EVs were isolated from PBMC using the standard protocol described in the Materials and Methods, prepared from >30 health donors. The levels of cytotoxic proteins were assayed using commercial ELISA kits for human perforin (U-CyTech Biosciences, CT391A), human granzyme-A (Boster Biosciences, EK1162), human granzyme-B (U-CyTech Biosciences, CT211A), granulysin (Biolegend, 438,007), and human FasL (RayBiotech, ELH-FAS1-1). The buffer contains non-ionic detergent to lyse the EVs. Thus, the quantitative measurements were the total proteins in our isolated NK EVs. All concentrations were calculated based on the standard curves from the individual kits. Dot Plots showed the concentration of NK-EVs versus EVs isolated from control cell lines, which included CHLA255 (neuroblastoma), SupB15 (acute lymphoblastic leukemia), D54MG (glioma), MCF7 (breast carcinoma), DU145 (prostate), Hela (cervical cancer), and HepG2 (hepatoma), were used as the controls. These non-NK-EV preparations have been described previously [Citation18]. Red circles indicate the protein level of the cytotoxic proteins derived from the EV preparation of a NK cell line, NK92. Y-axis indicates ng of a given cytotoxic protein per mL of NK-EV preparation. Note that the protein concentration scales on the Y-axis significantly differ among the cytotoxic proteins.
![Figure 1. Expression of cytotoxic proteins from different batches of NK-EV isolates.NK-EVs were isolated from PBMC using the standard protocol described in the Materials and Methods, prepared from >30 health donors. The levels of cytotoxic proteins were assayed using commercial ELISA kits for human perforin (U-CyTech Biosciences, CT391A), human granzyme-A (Boster Biosciences, EK1162), human granzyme-B (U-CyTech Biosciences, CT211A), granulysin (Biolegend, 438,007), and human FasL (RayBiotech, ELH-FAS1-1). The buffer contains non-ionic detergent to lyse the EVs. Thus, the quantitative measurements were the total proteins in our isolated NK EVs. All concentrations were calculated based on the standard curves from the individual kits. Dot Plots showed the concentration of NK-EVs versus EVs isolated from control cell lines, which included CHLA255 (neuroblastoma), SupB15 (acute lymphoblastic leukemia), D54MG (glioma), MCF7 (breast carcinoma), DU145 (prostate), Hela (cervical cancer), and HepG2 (hepatoma), were used as the controls. These non-NK-EV preparations have been described previously [Citation18]. Red circles indicate the protein level of the cytotoxic proteins derived from the EV preparation of a NK cell line, NK92. Y-axis indicates ng of a given cytotoxic protein per mL of NK-EV preparation. Note that the protein concentration scales on the Y-axis significantly differ among the cytotoxic proteins.](/cms/asset/ee4779d4-7ec0-4182-950f-04ce4f567f29/zjev_a_1588538_f0001_oc.jpg)
Figure 2. Correlation between levels of cytotoxic proteins from different NK-EV isolates.
The expression levels of individual cytotoxic proteins were cross-compared to each other to determine their R-square values.
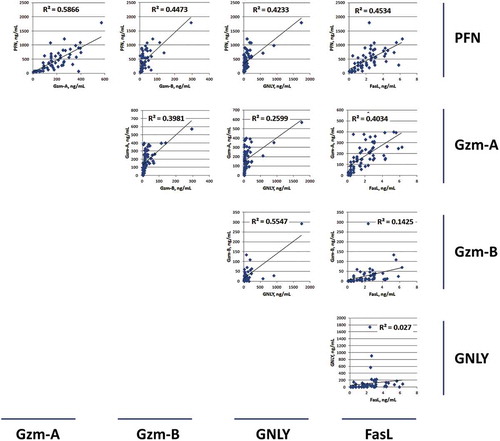
Figure 3. Cytotoxic activities of NK-EVs against solid tumors or tumor cell suspensions.
Cytotoxicity was determined based on the Acridine orange/Propidium iodide fluorescence assay: 104 cells (SupB15 or CHLA255) from log phase cell culture were transferred to 96-well plates in the presence of isolated EVs (40 μg) in a final volume of 100 μL. The suspensions were incubated at 37°C for 24 hr, and the percentage of dead cells was calculated by the LUNA cell counter. Linear regression line of cytotoxicity between CHLA255 and SupB15 was determined by the scatter plot.
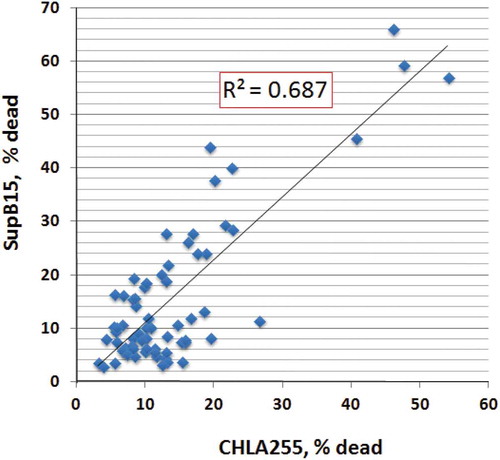
Table 1. Summary of R-squared values for cytotoxic proteins against solid tumors and tumor cell suspensions.
Figure 4. Correlation between cytotoxic proteins and cytotoxicity against neuroblastoma CHLA255 and ALL SupB15.
The levels of the cytotoxic proteins and cytotoxicity of EV isolates were compared using scatter plots. R-squared values were determined using Excel software. The individual cytotoxic proteins versus cytotoxicity of CHLA255 (A) and SupB15 (B) from each EV isolate were plotted.
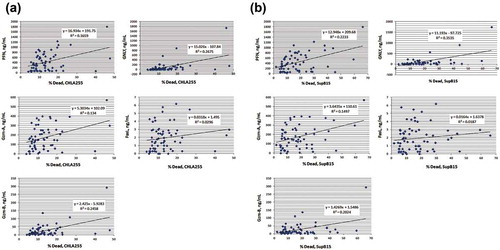
Figure 5. NK-EVs cleave granzyme A substrates SET and HMG2 proteins in the target cells.
Neuroblastoma CHLA255 (A) or ALL SupB15 (B) cells were treated with different amounts of NK-EVs (upper panel) or harvested at different time-points after treatment (lower panel) as indicated. Untreated cells were used as controls (CL). After incubation, cells were harvested and lysed in SDS-PAGE sample buffer. Each lane contains 30-μg cell lysate proteins as determined by the Orbit® protein assay (Life Technologies). Antibodies against SET (Santa Cruz Biotech, sc-133,138) were used to probe the blots. The same blot was stripped and re-probed with anti-HMG2 antibody (Cell Signalling Technology, #14,163). β-Actin was used as the loading control. Western blot signals were qualified by the program ImageJ from at least three independent experiments (n ≥ 3). The plots with the standard derivation were shown in Supplementary Figure S5.
Figure 6. NK-EVs induce release of cytochrome C from mitochondria in the target cells.
(a) CHLA255 cells were treated without (upper panel) or with NK-EVs (lower panel) for 12 hr and prepared for immunofluorescence microscopic studies, as described in the Methods and Material section. After extensive washes, the slides were probed with the MitoTracker dye (green), a Rhodamine conjugate of an antibody against cytochrome C (red). The slide was then sealed with mounting solution containing DAPI (blue).
(b)Upper panel: mitochondrial (M) and cytosolic (C) fractions were isolated by the Cytochrome C Release Apoptotic kit in the absence (-) or presence (+) of isolated NK-EVs, as described in Methods and Materials. Each sample of the mitochondrial or cytosolic fractions was derived from ~5x10⁷ SupB15 cells and loaded on a 14% SDS-PAGE. The cytochrome C bands (Cyto-C) were shown on the Western blot. Lower panel: quantitative analysis of cytochrome C signals were measured by the program ImageJ from three independent experiments (n = 3). Mitochondrial fractions and cytosolic fractions were indicated as green bars and blue bars, respectively. The standard derivation was shown. ** P < 0.001.
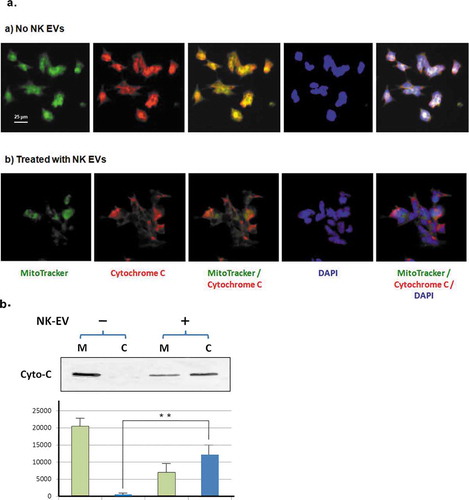
Figure 7. NK-EVs induce ER stress in the target cells.
ALL NALM6 cells were treated with NK-EVs for different time points as indicated. Cells were then harvested and lysed in SDS-PAGE sample buffer. Each lane contains 30-μg cell lysate proteins as determined by the Orbit® protein assay (Life Technologies). Antibodies against BiP, Ero1-Lα, IRE1α, Calnexin, PERK and Pi-eIF2α from the ER Stress Antibody Sampler Kit (Cell Signalling technology, #9956S) were used to probe the blots according to the manufacturer’s protocol. β-Actin was used as the loading control. Abbreviations: BiP: pre-B Immunoglobulin heavy chain binding Protein; Ero 1-Lα: ER-residing protein endoplasmic oxidoreductin-1-like α-form; IRE1α: Inositol-requiring enzyme 1α; Calnexin: calcium-binding, endoplasmic reticulum (ER)-associated protein; PERK: Protein kinase-like endoplasmic reticulum kinase; Pi-elF2 α: phosphorylated elongation factor 2 α. Western blot signals were qualified by the program ImageJ from at least three independent experiments (n ≥ 3). The plots with the standard derivation were shown in Supplementary Figure S7.
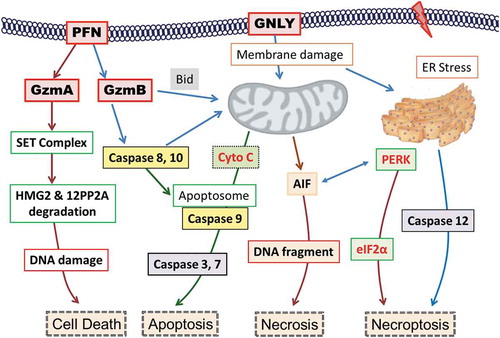
Figure 8. Summary of the potential killing mechanisms of NK-EVs exerting onto target cells.
Cell death may be induced by perforin-generated membrane holes for granzyme A and granzyme B entry, or by granulysin-damaged membrane, or by other un-defined factors. The cytotoxic proteins of NK-EVs may rely on these mechanisms to activate the caspase-dependent and -independent cascade, to cause ER stress, and subsequently to induce cell death.PFN, perforin; GzmA, granzyme A; GzmB, granzyme B; GNLY, granulysin; SET: an 270 ~ 420 KDa ER-associated complex; HMG: high mobility globulin; 12PP2A: 12 protein phosphatase 2A; CytoC, cytochrome C; AIF, apoptosis-inducing factor; PERK, Protein kinase-like endoplasmic reticulum kinase; elF2α, elongation factor 2α; Bid, BH3-interacting domain.