Figures & data
Figure 1. Cancer patients have elevated circulating nanoparticles. (a) Circulating plasma particles were analysed by NTA. Sizes of plasma particles did not differ significantly between groups. (b) Patients with glioblastoma (GBM), anaplastic astrocytoma (AA), brain metastasis and meningioma display elevated circulating particle counts. (c) Representative NTA graphs are shown. ANOVA, posthoc Bonferroni/Dunn was performed for multiple group comparison (**** = p < 0.001, *** = p < 0.001; ** = p < 0.01; * = p < 0.05) .
Figure 2. Tetraspanin expression is elevated in glioblastoma tissue. (a) The expression of CD81, CD9 and CD63 is elevated in human glioblastoma (GBM) tissue as determined by analysing the TCGA database. (b) Glioblastoma patients with elevated CD81 expression show decreased survival, whereas CD63 and CD9 expression levels do not correlate with survival. mRNA expression levels and clinical data were obtained and analysed through the GlioVis portal (http://gliovis.bioinfo.cnio.es).
Figure 3. IFCM detects multi-coloured nano-scaled beads. (a) Heterogeneous fluorescent beads were analysed by IFCM. 500, 240, 200 and 160 nm beads can be discriminated through their characteristics in brightfield (BF), fluorescent intensity (FITC/PE) and sideward scatter (SSC). Note that 500 nm beads are visible in BF, SSC and FITC while at 200 nm beads lose their SSC intensity and the BF image is lost at 160 nm. Fluorescence is still detected on 100 nm beads. (b) According to their SSC and GFP intensity, heterogeneous fluorescent beads can be discriminated by IFCM. Speed beads as well as all types of smaller beads can be separated by their fluorescence intensity and SSC intensity. Top, complete dotplot; bottom, zoom-in for better visibility.
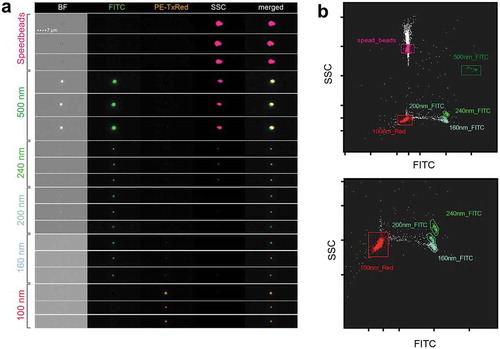
Figure 4. Analysis of single EVs by CLEM and IFCM. (a) Workflow of EV labelling. EVs are isolated from glioblastoma cell culture medium, stained and subsequently washed by using a 300 kDa filter before being analysed by correlative light and electron microscopy (CLEM) and IFCM (representative images). (b) CLEM of CD9 (red), CD63 (blue) and CD81 (green) stained EVs from two different cell lines. 200 nm beads were spiked into the sample for spatial orientation in transmission electron microscopy (TEM). White arrowheads indicate fluorescence positive single EVs and mark an example of a triple positive EV (GS-60) as well as an example of a single positive EV (SK-MEL28). White arrows indicate fluorescence positive events that do not appear as EV-like structures in TEM. (c) IFCM allows the detection of CD9, CD63 and CD81 positive EVs. Gating strategy for EV analysis. (d) Controls for anti-CD81 (FITC) and anti-CD63 (PacBlue) EV staining measured by IFCM include (i) buffer only, (ii) unstained EVs and (iii) EVs lysed with NP40 (0.5% for 30 min) and stained medium, acquired for the same time as stained EVs. Representative IFCM pictures are shown. (e) Three individual EV preparations from plasma of healthy donors were analysed for their EV concentration and mean fluorescence intensity (MFI) of anti-CD9-PE stained EVs by IFCM in serial dilutions. Positive events found in stained media were used as background control. (f) EVs from SK-MEL28, GSC5 and plasma samples were stained with antibodies against CD9, CD63 and CD81 coupled with FITC, PE or PacBlue in concentrations described in the materials and methods.
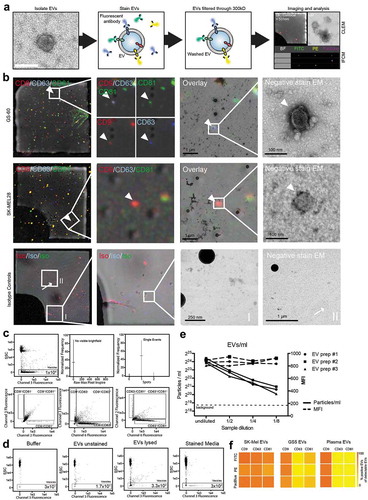
Figure 5. Tetraspanin profiles of tumour cell lines and secreted EVs. (a) Non-tumour cells, cancer cell lines and glioblastoma cell lines were analysed for CD9, CD63 and CD81 expression by qPCR (upper panel) and by conventional flow cytometry on permeabilized cells (lower panel). Every cell type expresses all three tetraspanins. Relative amounts of target mRNA were normalized to 18S as internal control. Transcript levels were normalized to CD81 expression in CD4+ T-cells. All experiments were run as triplicates (qPCR) or duplicates (flow cytometry); mean relative expression values and mean fluorescence intensity (MFI), respectively, are shown. (b) EVs secreted from the same cell types were analysed by IFCM for CD9, CD63 and CD81 (top). Double positive EVs (CD81+/CD9+, CD9+/CD63+, CD81+/CD63+) are depicted below. Positive EV counts were calculated as the fraction of EVs positive for a tetraspanin in relation to all EVs captured by either anti-CD9, -CD63 or -CD81. All experiments were performed in duplicate and mean values are shown. (c) Representative NTA analysis of non-tumour cells and tumour cell line-derived EVs. (d) Groupwise comparisons of the data presented for individual samples in B). Values are means ± SD. (e) Representative IFCM for EVs and corresponding permeabllized cells of origin (left). Note that tumour cells display an increased spatial overlap of CD9, CD63 and CD81 expression, as indicated by the similarity score analysis (right). Results are representative of at least three biological repeat experiments. Individual student’s t-test was performed to compare two groups (** = p < 0.01; * = p < 0.05) .
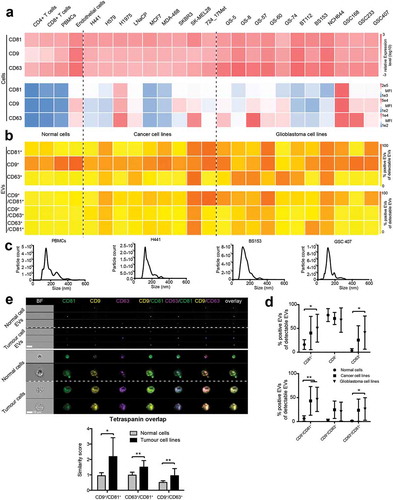
Figure 6. Cellular and vesicular tetraspanin responses to various cell stimuli. (a) Three glioblastoma cell lines (GS-8 (triangle), GS-57 (circle), BT112 (square)) were cultured under hypoxic conditions (0.1% O2) or differentiating condition (medium containing EV-depleted FBS). Cellular CD81, CD9 and CD63 expression was measured by qPCR, and transcript levels were normalized to 18S. Expression values of pooled GS-8, GS-57 and BT112 cells are shown as means + SD and were normalized to cells under normoxia. (b) Hypoxic cell adaptation was confirmed by induction HK2 and GLUT1, and differentiation was confirmed by elevated expression of GFAP as well as downregulation of OLIG2, PAX6, POU5F1 and SOX2. Expression values of pooled GS-8, GS-57 and BT112 are shown as means + SD. (c) Corresponding EVs were analysed for CD81, CD9 and CD63 by IFCM, and single (left) as well as double (right) positive EVs are shown and calculated as fraction of positive EVs of CD9, CD63 or CD81 positive EVs. EV profiles of GS-8, GS-57 and BT112 were pooled and values are shown as mean + SD normalized to cells under normoxia. Results are representative of at least three biological repeat experiments. ANOVA, posthoc Bonferroni was performed for multiple group comparisons and student’s t-test was performed to compare two individual groups (**** = p < 0.0001, *** = p < 0.001, ** = p < 0.01; * = p < 0.05) .
Figure 7. Tetraspanin profiles of circulating EVs in glioblastoma patients. (a) Plasma EVs from healthy donors and patients with glioblastoma (GBM) or anaplastic astrocytoma (AA) were analysed for CD9, CD81 and CD63 by IFCM. Positive EV counts were calculated as the fraction of EVs positive for a tetraspanin in relation to all EVs captured by anti-CD9, -CD63 or -CD81. Both patient groups display significantly higher numbers of circulating CD63+ EVs (top) as well as an increased proportion of CD63+ EVs among all total plasma EVs (bottom). (b) Double positive CD63+/CD81+ and CD9+/CD63+ plasma EV levels are elevated in glioblastoma patients (top), and the proportion of all possible combinations of double positive EVs is increased compared to healthy donors. ANOVA, posthoc Bonferroni was performed for multiple group comparisons. *** = p < 0.001; ** = p < 0.01; * = p < 0.05.
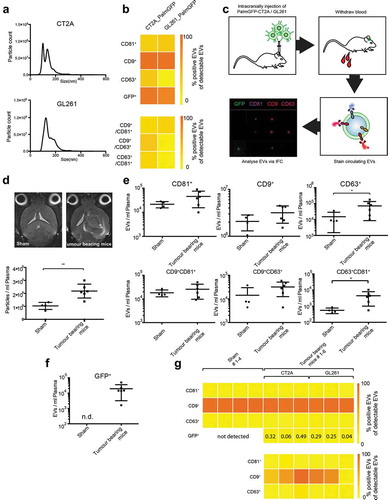
Figure 8. IFCM allows tracking of circulating tumour EVs in a mouse glioma model. (a) NTA analysis of EVs secreted from PalmGFP-CT2A and PalmGFP-GL261 cells in vitro. (b) IFCM analysis shows strong expression of CD9 and GFP on the secreted EVs (top). Positive EV counts were calculated as the fraction of EVs positive for a tetraspanin in relation to all EVs captured by anti-CD9, -CD63 or -CD81. Similar amounts of CD81+/CD9+ EVs were detected in both cell lines, while higher percentages of EVs from CT2A cells are double positive for CD9+/CD63+ and CD81+/CD63+ compared to GL261 cells (bottom). (c) Workflow of tumour cell injection and IFCM detection of murine plasma EVs. (d) Tumour-bearing mice display elevated plasma EV counts compared to sham-injected mice, as measured by NTA analysis. Top, MRI images of injected mice; bottom, plasma particle counts. (Tumour-bearing mice consist of pooled GL261 and CT2A injected mice.) (e) Tetraspanin profiles of plasma EVs measured by IFCM. Tumour-bearing mice show elevated CD63+ EVs as well as double positive CD81+/CD63+ EVs. (f) GFP+ positive EVs were detected in plasma of tumour-bearing mice but not detectable (n.d.) in sham-operated animals. (g) Top, percentage expression of tetraspanin markers and of GFP on total plasma EVs. GPF+ EVs constitute between 0.04% and 0.49% in different mice. Bottom, tetraspanin expression on GFP+ glioma-derived EVs. Student’s t-test was performed to compare two groups. ** = p < 0.01; * = p < 0.05.